Introduction
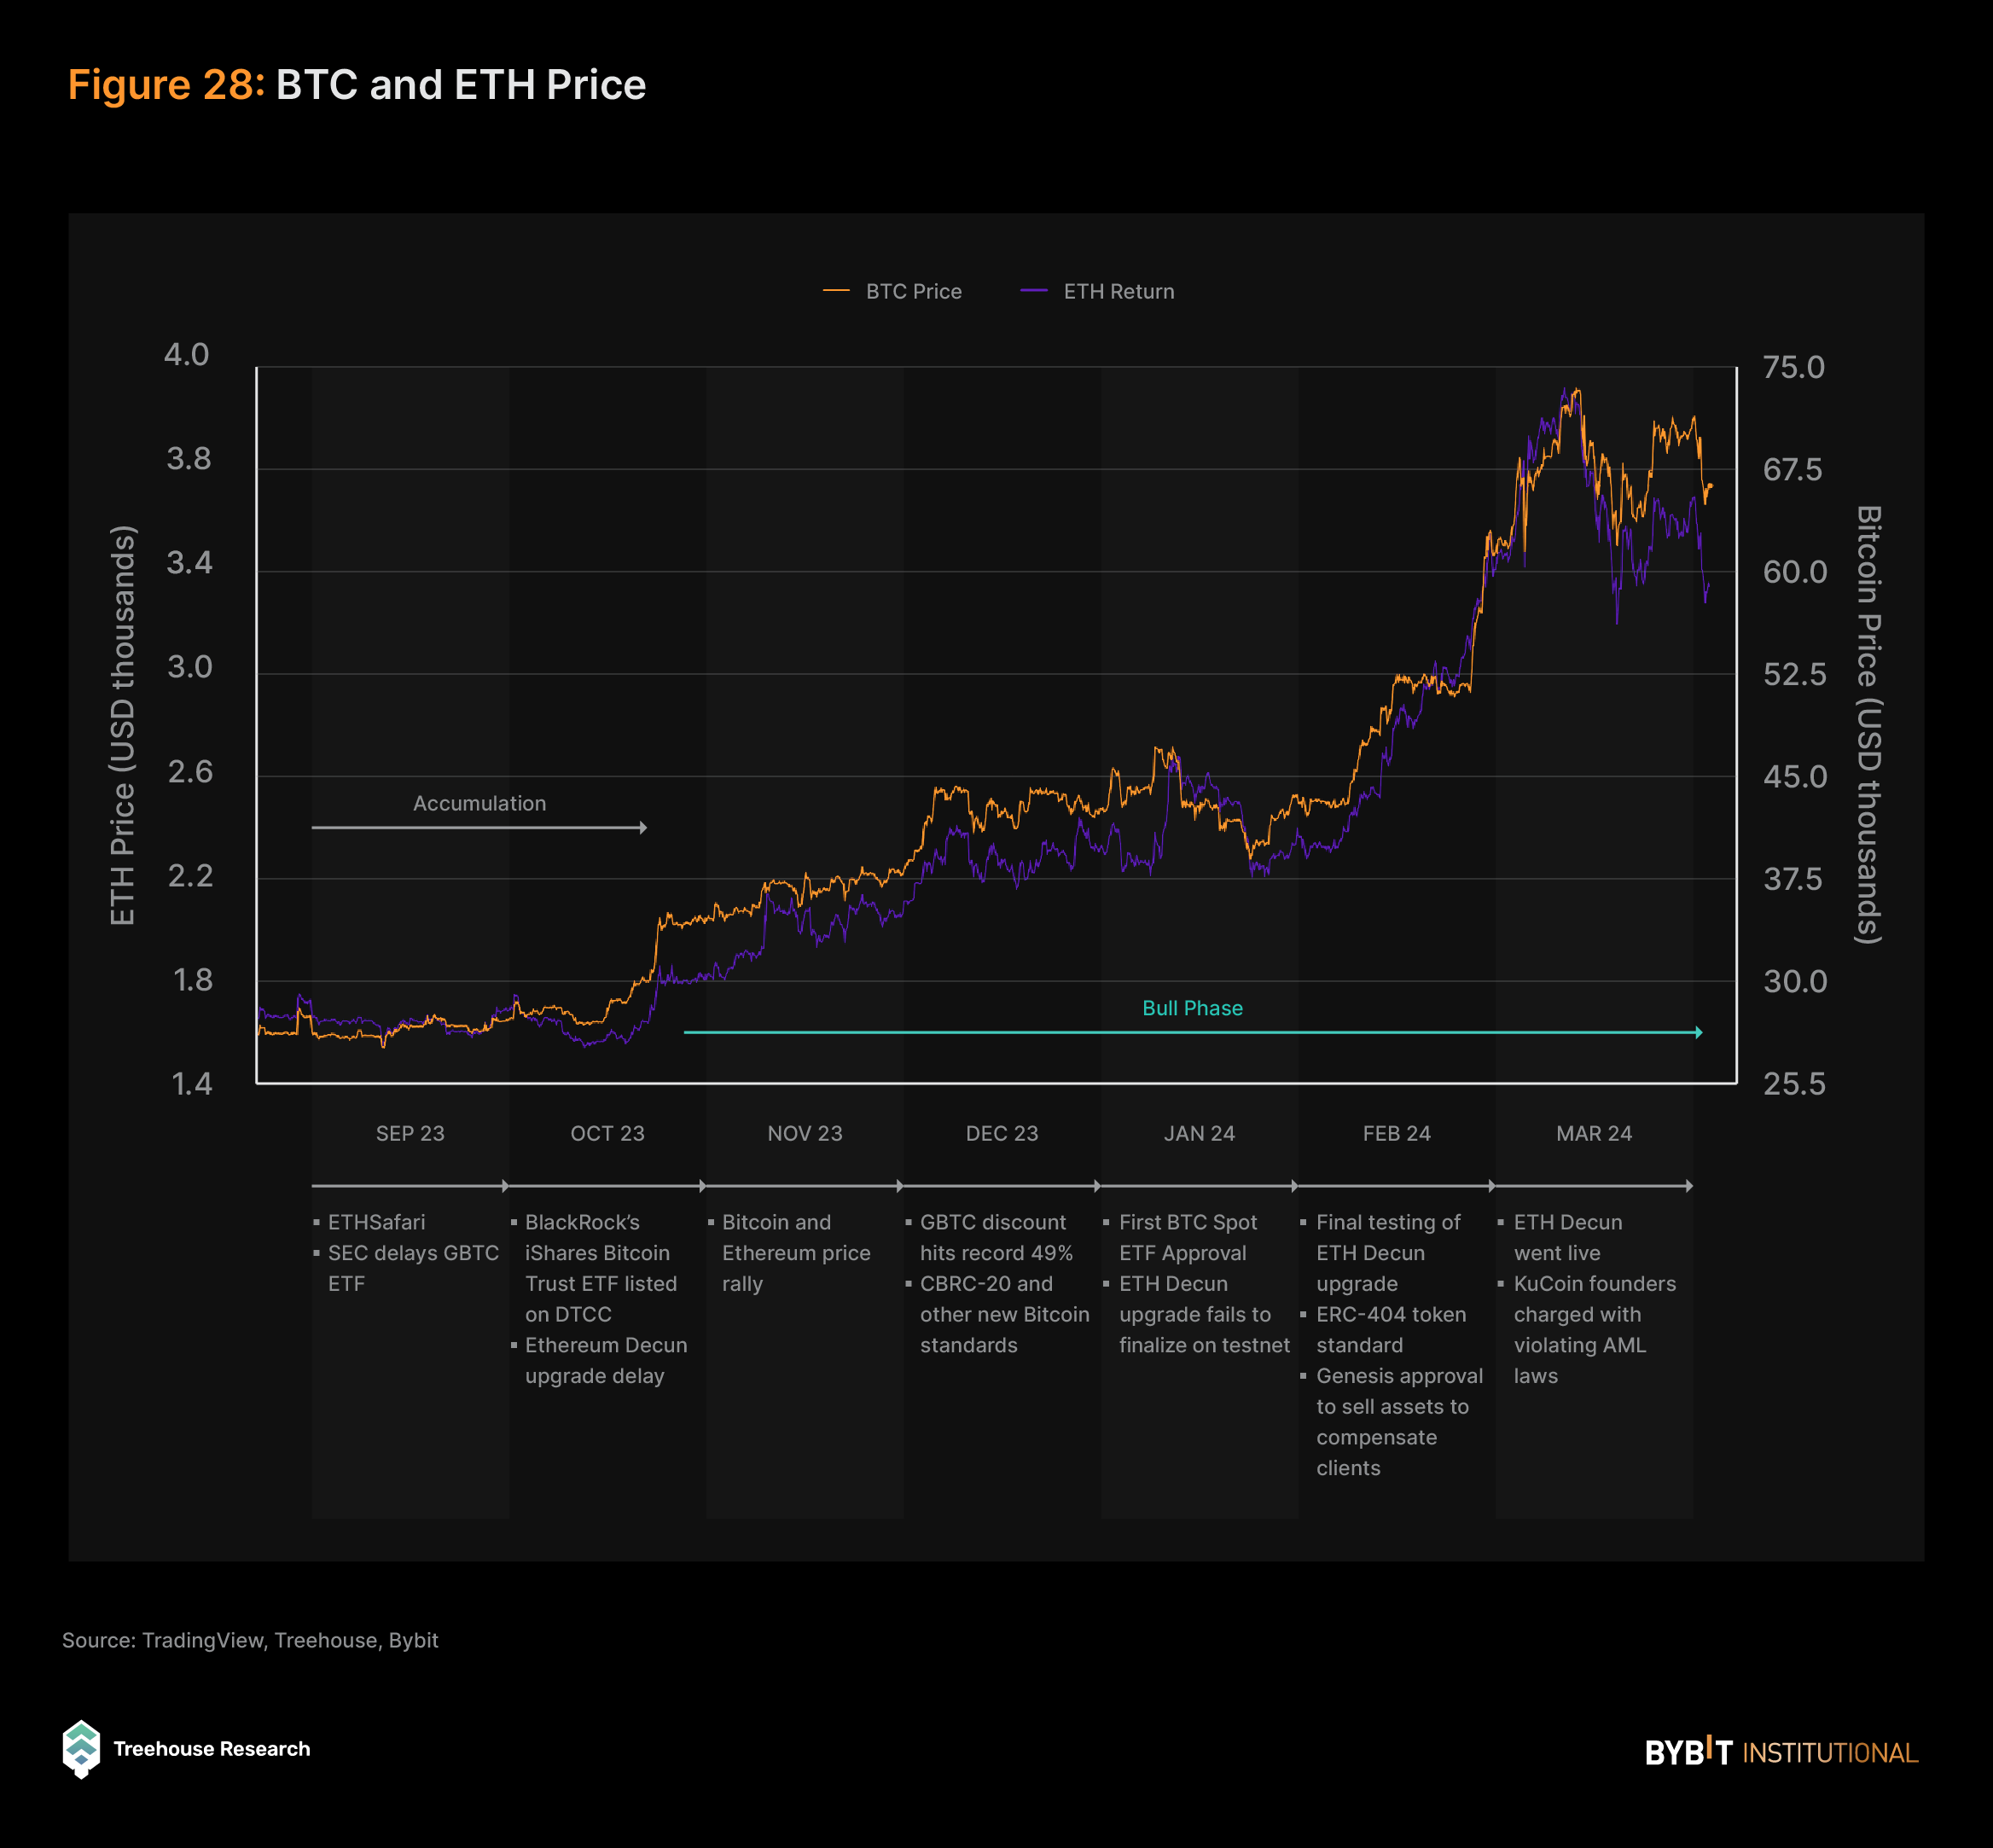
The end of 2023 was marked by a series of notable events that reverberated throughout the cryptocurrency market, shaping its trajectory and influencing investor sentiment. With recent geopolitical tensions and financial market instability, the macroeconomic landscape has experienced turbulence, with conflicts such as the Hamas/Israel war in October and the weakening of Chinese financial markets.
Notable transformations in the regulatory landscape have exerted profound effects upon market dynamics. Ripple’s triumph in the SEC lawsuit on Jul 13, 2023, marked a significant milestone, reflecting a shift in the U.S. government’s approach to cryptocurrencies. Additionally, Binance founder Changpeng Zhao pled guilty to money-laundering violations, which reverberated throughout the crypto industry and highlighted the heightened scrutiny and regulatory challenges faced by major players. Finally, the surge of interest following the recent Bitcoin Spot ETF approvals has impacted the regulatory environment, influencing investor perceptions and shaping overall market sentiment.
Toward the end of 2023, anticipation surrounding Bitcoin Spot ETFs reached a fever pitch. However, contrary to expectations, the approval didn’t result in the immediate astronomical returns that many had hoped for. Instead, concerns emerged over Grayscale’s selling pressure as institutional investors fled to cheaper alternatives to gain exposure in Bitcoin, weighing heavily on market sentiment. Nevertheless, as the bearish sentiment towards the large outflow settles, Bitcoin ETF net inflows hit a record of $2.5B on the week of March 11, 2024. During the same week, Bitcoin also achieved an unprecedented milestone, breaking the previous all-time high of $69,000 and reaching a peak of almost $74,000.
The narratives from Q4 2023 have persisted into the early part of 2024, providing valuable insights into the potential long-term trajectory of the industry. As we progress further, it’s evident that these themes are continuing to shape the landscape of digital assets, offering opportunities and challenges for institutional stakeholders. In the later part of this report, we’ll highlight several themes anticipated for 2024, encouraging institutional stakeholders to explore the evolving landscape of digital assets with more informed perspectives.
Crypto Outperforming Traditional Assets
From Q4 2023 through Q1 2024, BTC and ETH surged on the back of renewed interest driven by the ETF narratives, posting impressive returns of 155.35% and 105.71%, respectively during the period. This resurgence highlighted the enduring appeal of these leading digital assets, as investors sought exposure to the burgeoning crypto market.
On the other hand, traditional financial (TradFi) markets witnessed mixed performance during the same period. Although generally trending upward, September to November saw downturns attributed to the Federal Reserve’s decision to maintain elevated interest rates. This action propelled bond market yields to their highest levels in over a decade, negatively impacting stock prices.
Despite these challenges, major indices such as the S&P 500, Nasdaq-100®, and Dow Jones Industrial Average managed to record respectable returns from September 2023, reaching new all-time highs. Specifically, these indices registered returns of 16.56%, 17.76%, and 14.65%, respectively in the last 6 months, highlighting the resilience of the broader equity market amid macroeconomic uncertainties.
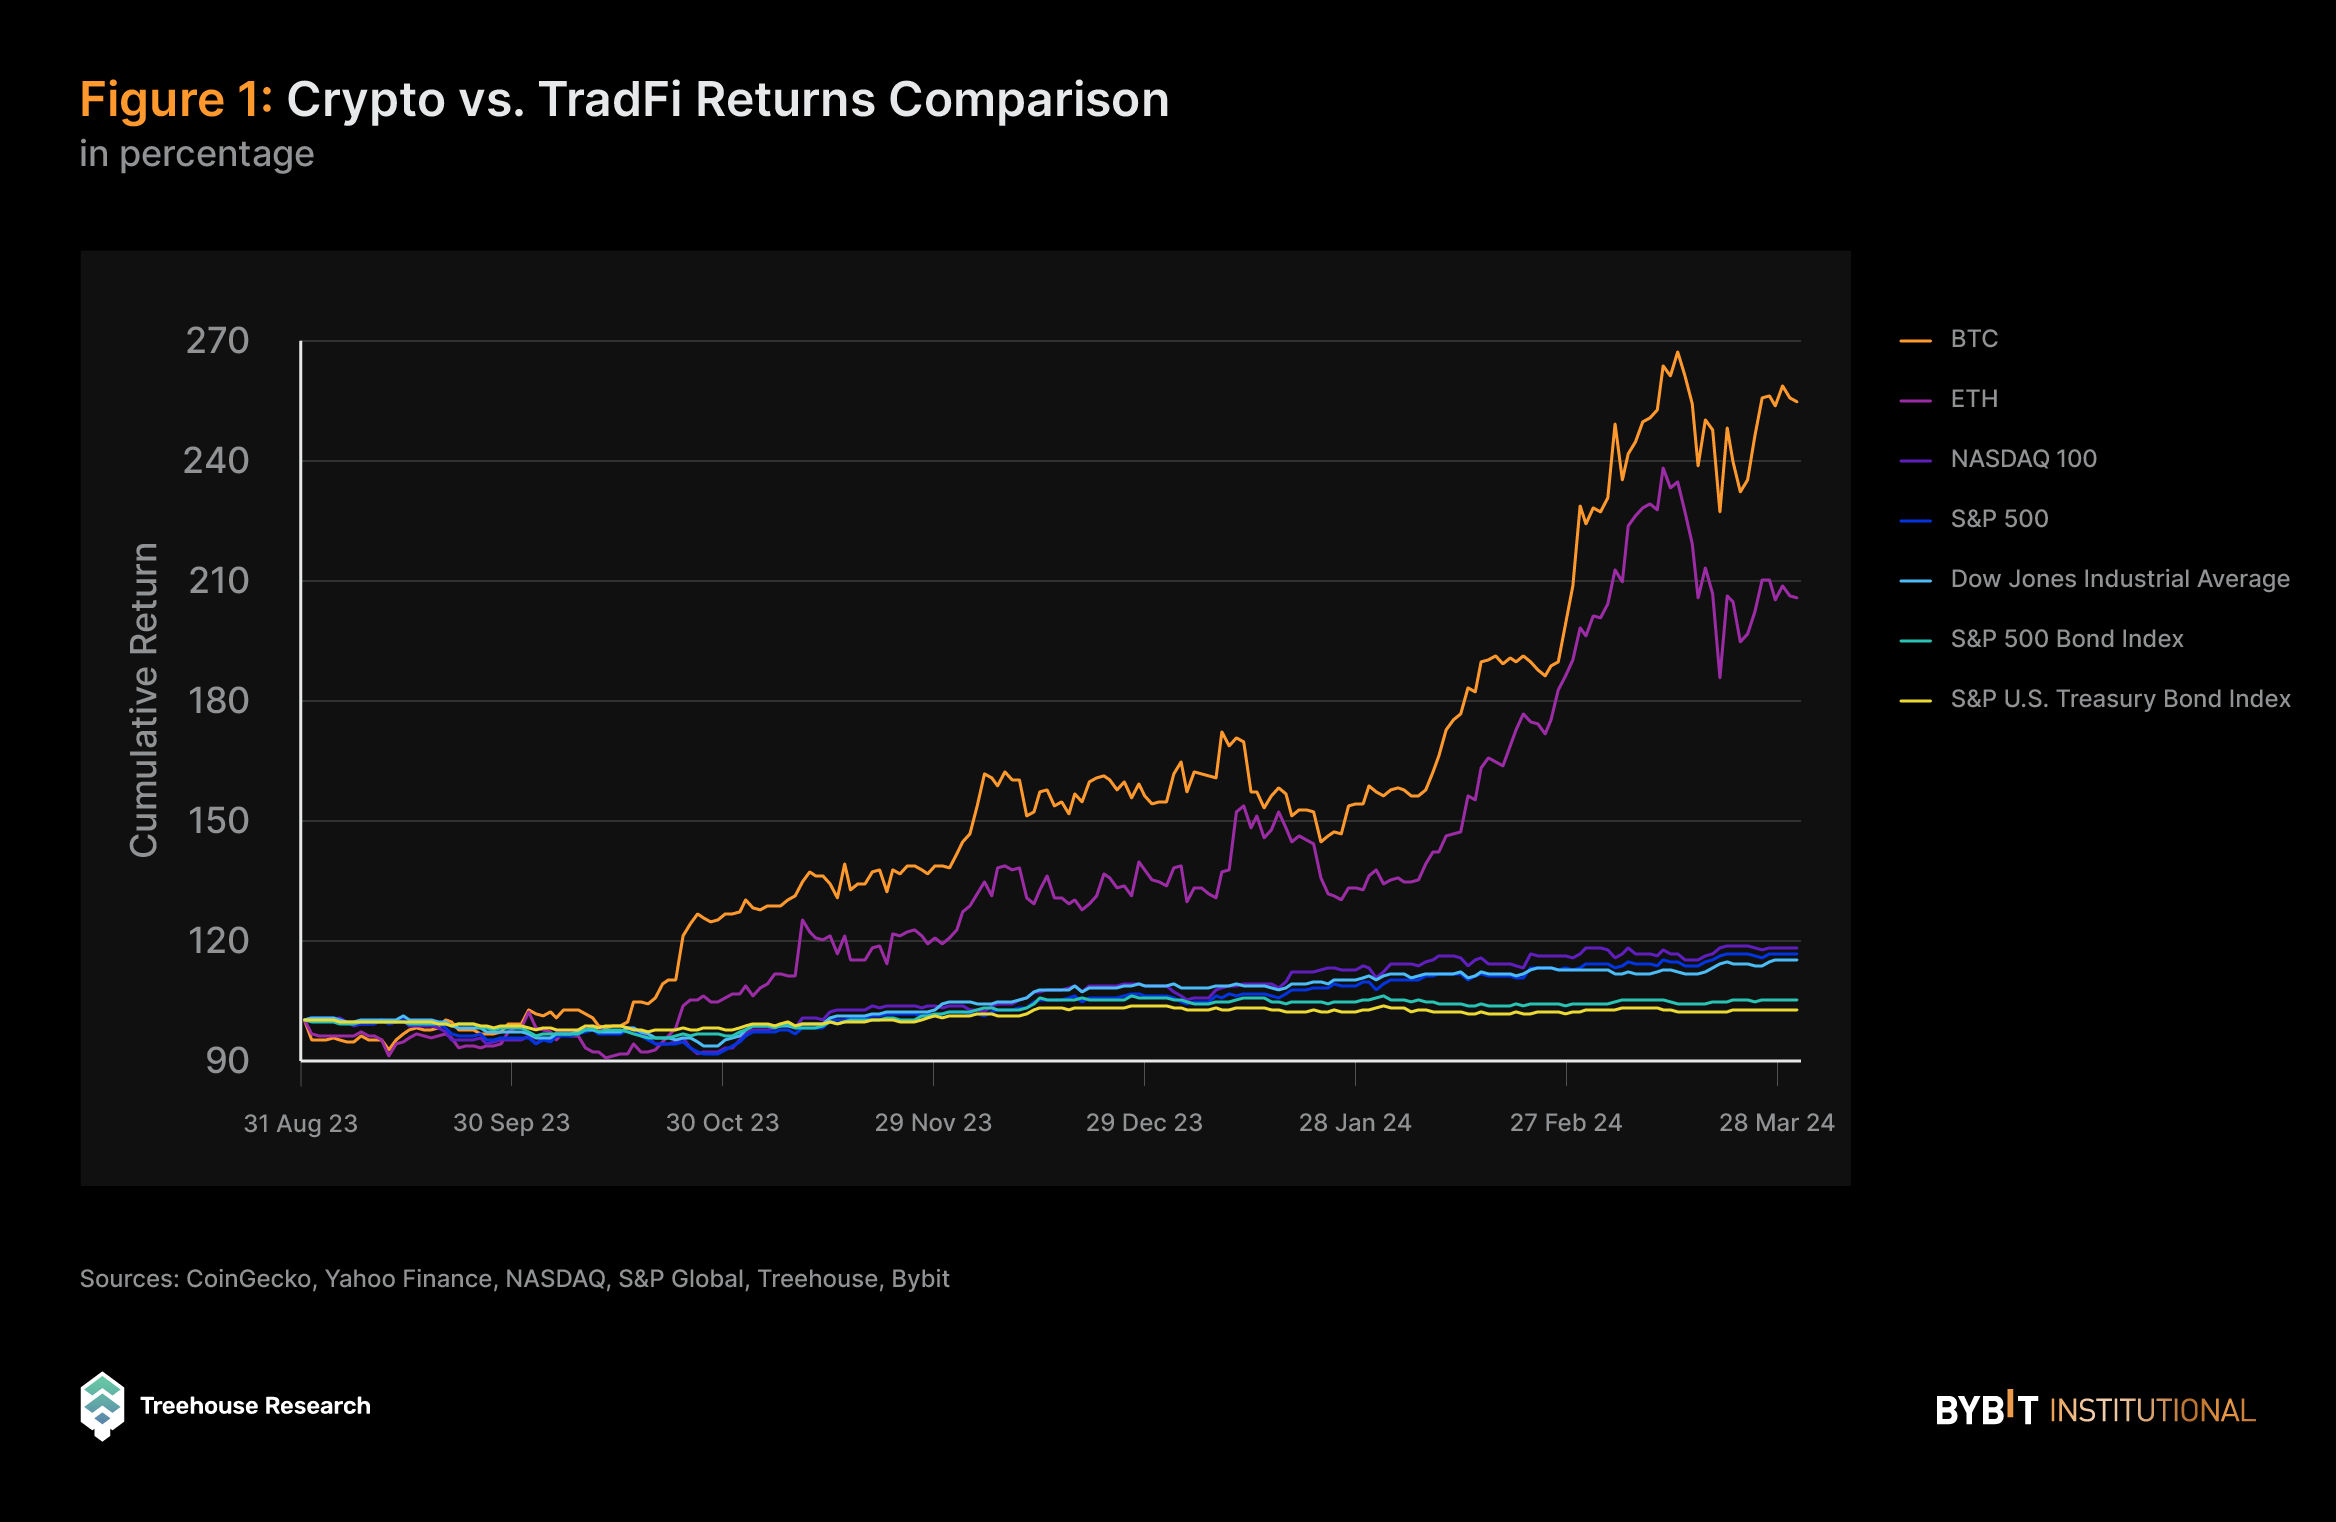
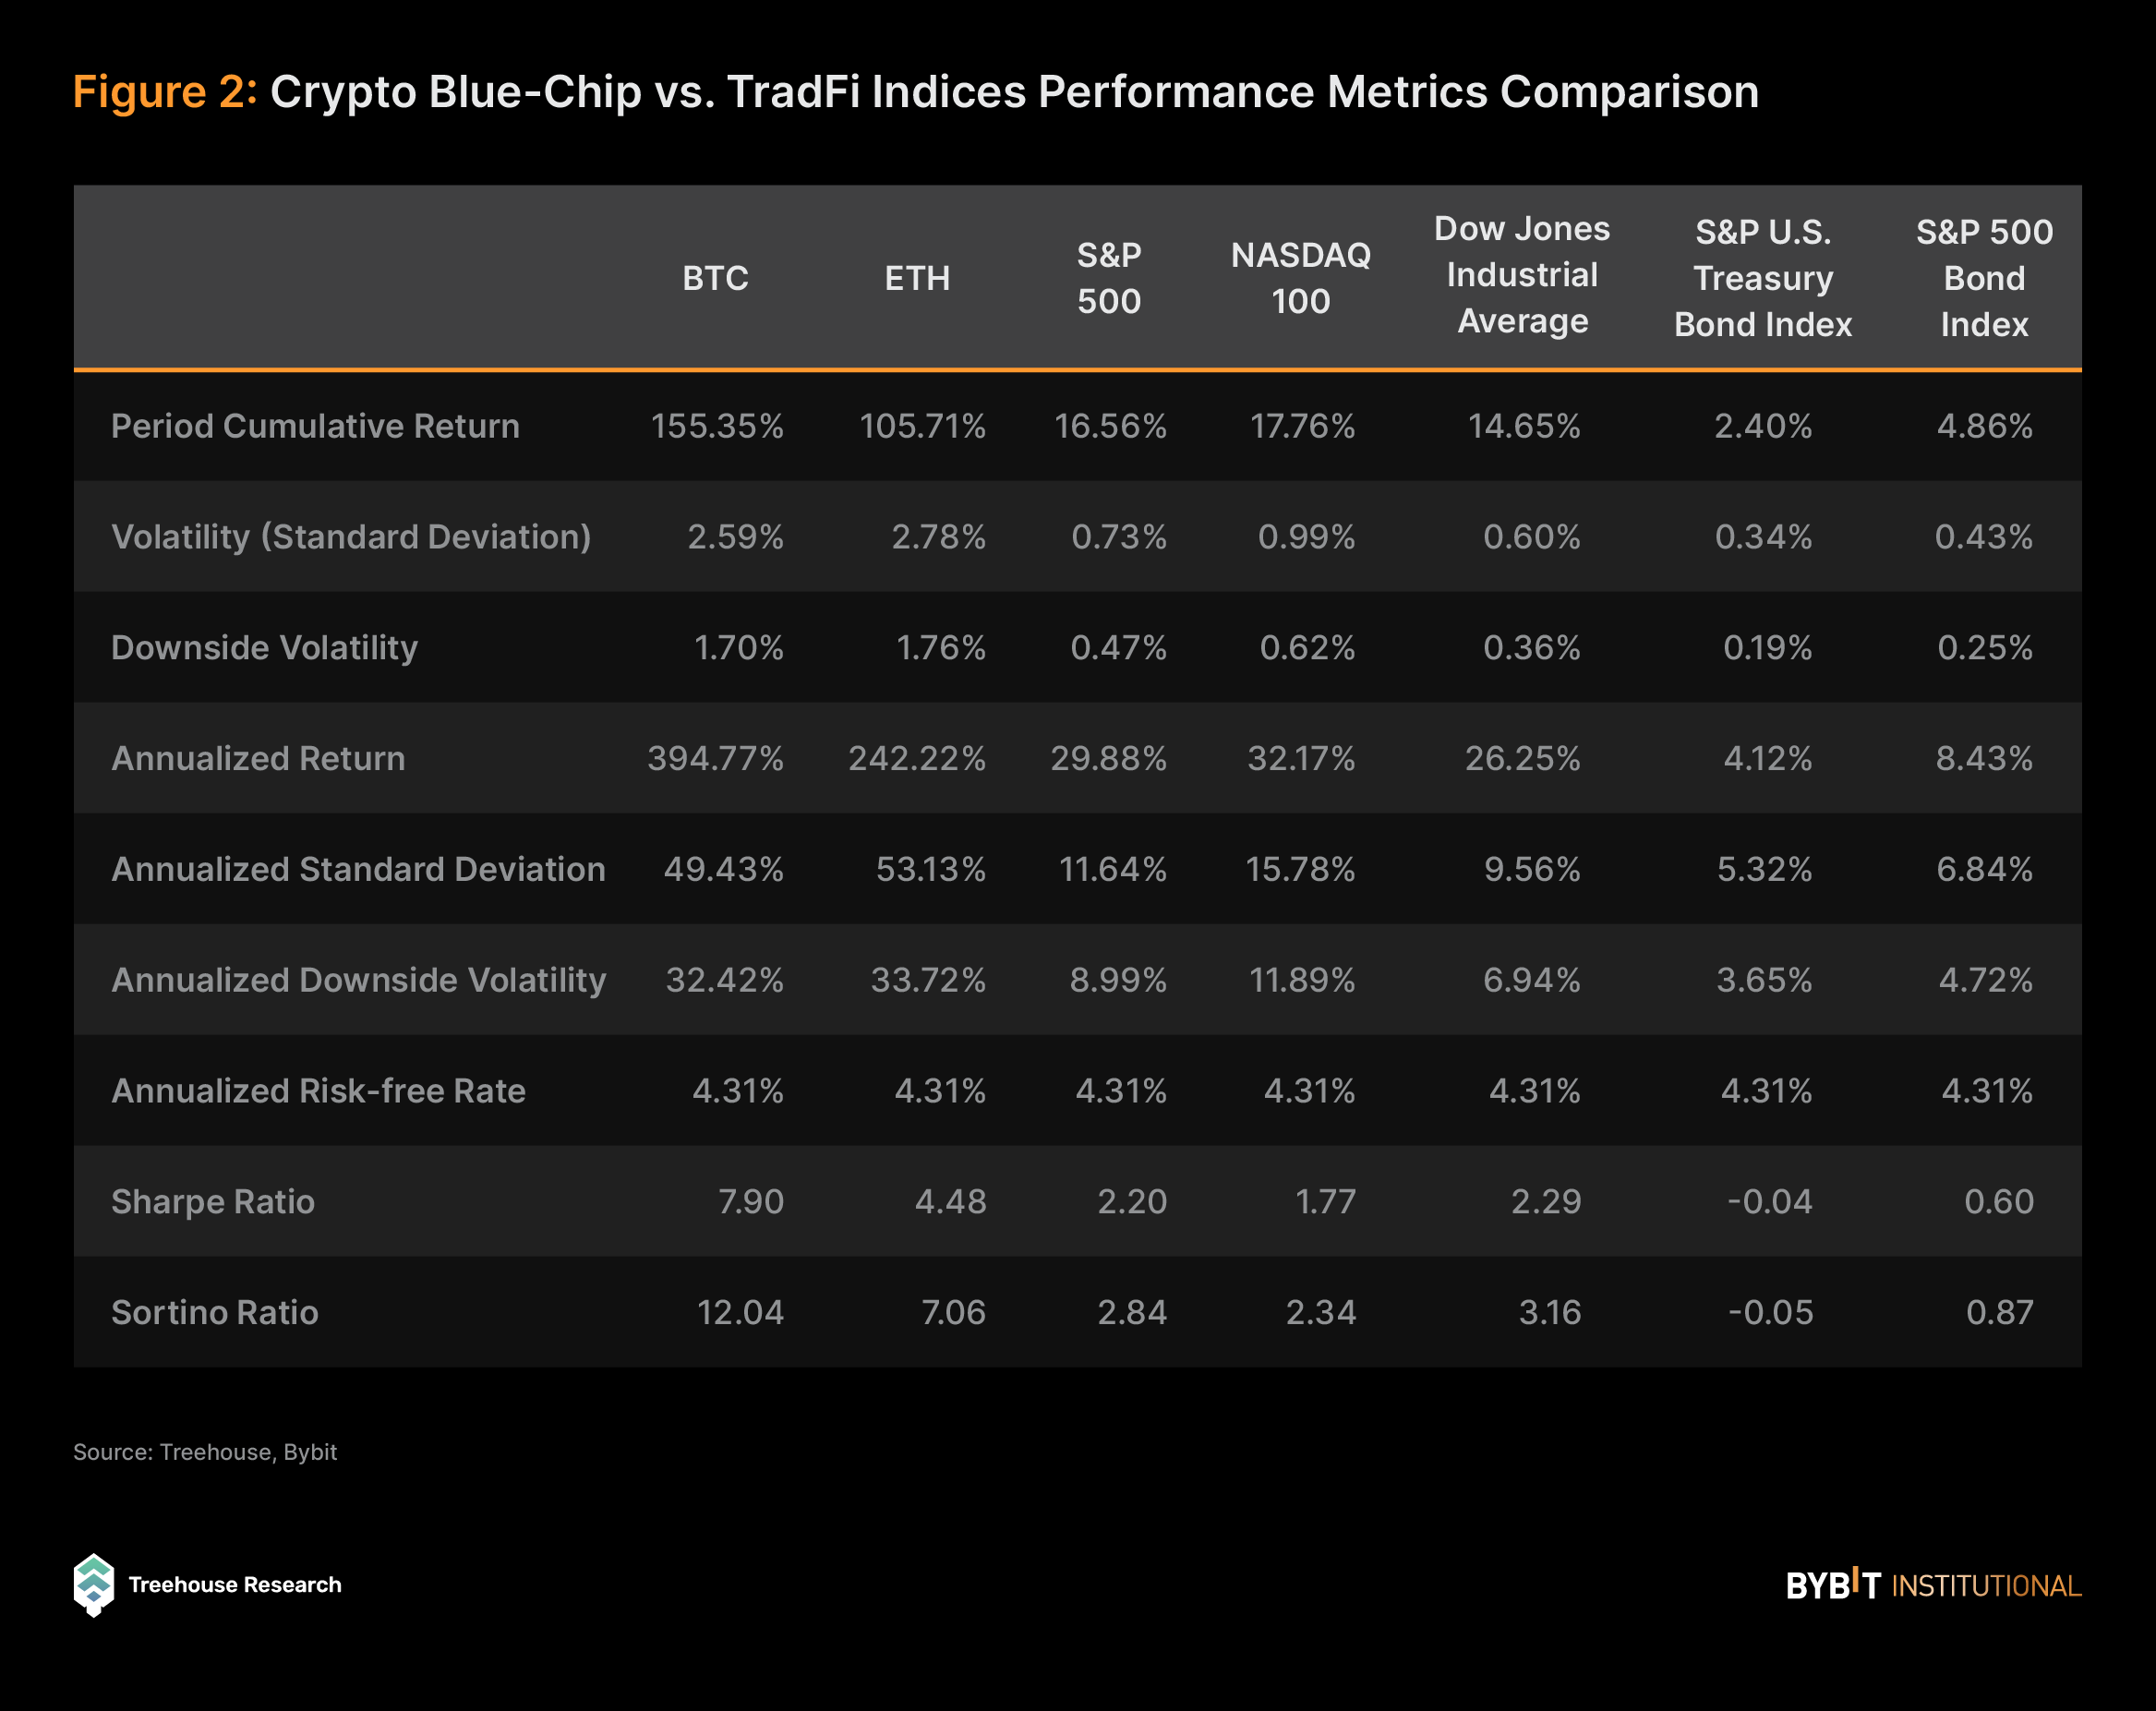
On a comparative basis, BTC and ETH exhibited much superior returns in this period in absolute percentage terms as compared to all TradFi indices (equities and fixed income alike). However, despite being the blue chips of the crypto market, BTC and ETH continue to experience extensive volatility, with their standard deviations of return significantly higher than that of the traditional market. In fact, their volatility exceeds that of the Nasdaq-100, the most volatile TradFi index (composed mostly of technology stocks), by 3.13 times and 3.37 times, respectively.
However, if we focus exclusively on the downside risk of returns on a daily interval, the volatilities reduce slightly in relative terms, as BTC and ETH exhibit volatilities at 2.73 and 2.84 times that of Nasdaq-100, respectively.
Despite their higher volatilities, BTC and ETH demonstrate superior risk-adjusted returns compared to all index benchmarks in the TradFi markets. Even the DJIA, known for its stable large-cap industrial and consumer companies, only achieves roughly half of ETH’s Sharpe ratio, while BTC exceeds that of DJIA by more than 3.4 times. This discrepancy is even more pronounced when considering only downside risks through the Sortino ratio, where BTC and ETH outperform by 3.8 times and 2.2 times, respectively.
Navigating USDT Dominance and Circle’s IPO: Implications for Stablecoin Markets
The rising market cap of stablecoins observed in the given period highlights the increasing liquidity flowing into the cryptocurrency market. This trend suggests a growing willingness among market participants to capitalize on emerging opportunities within the crypto space.
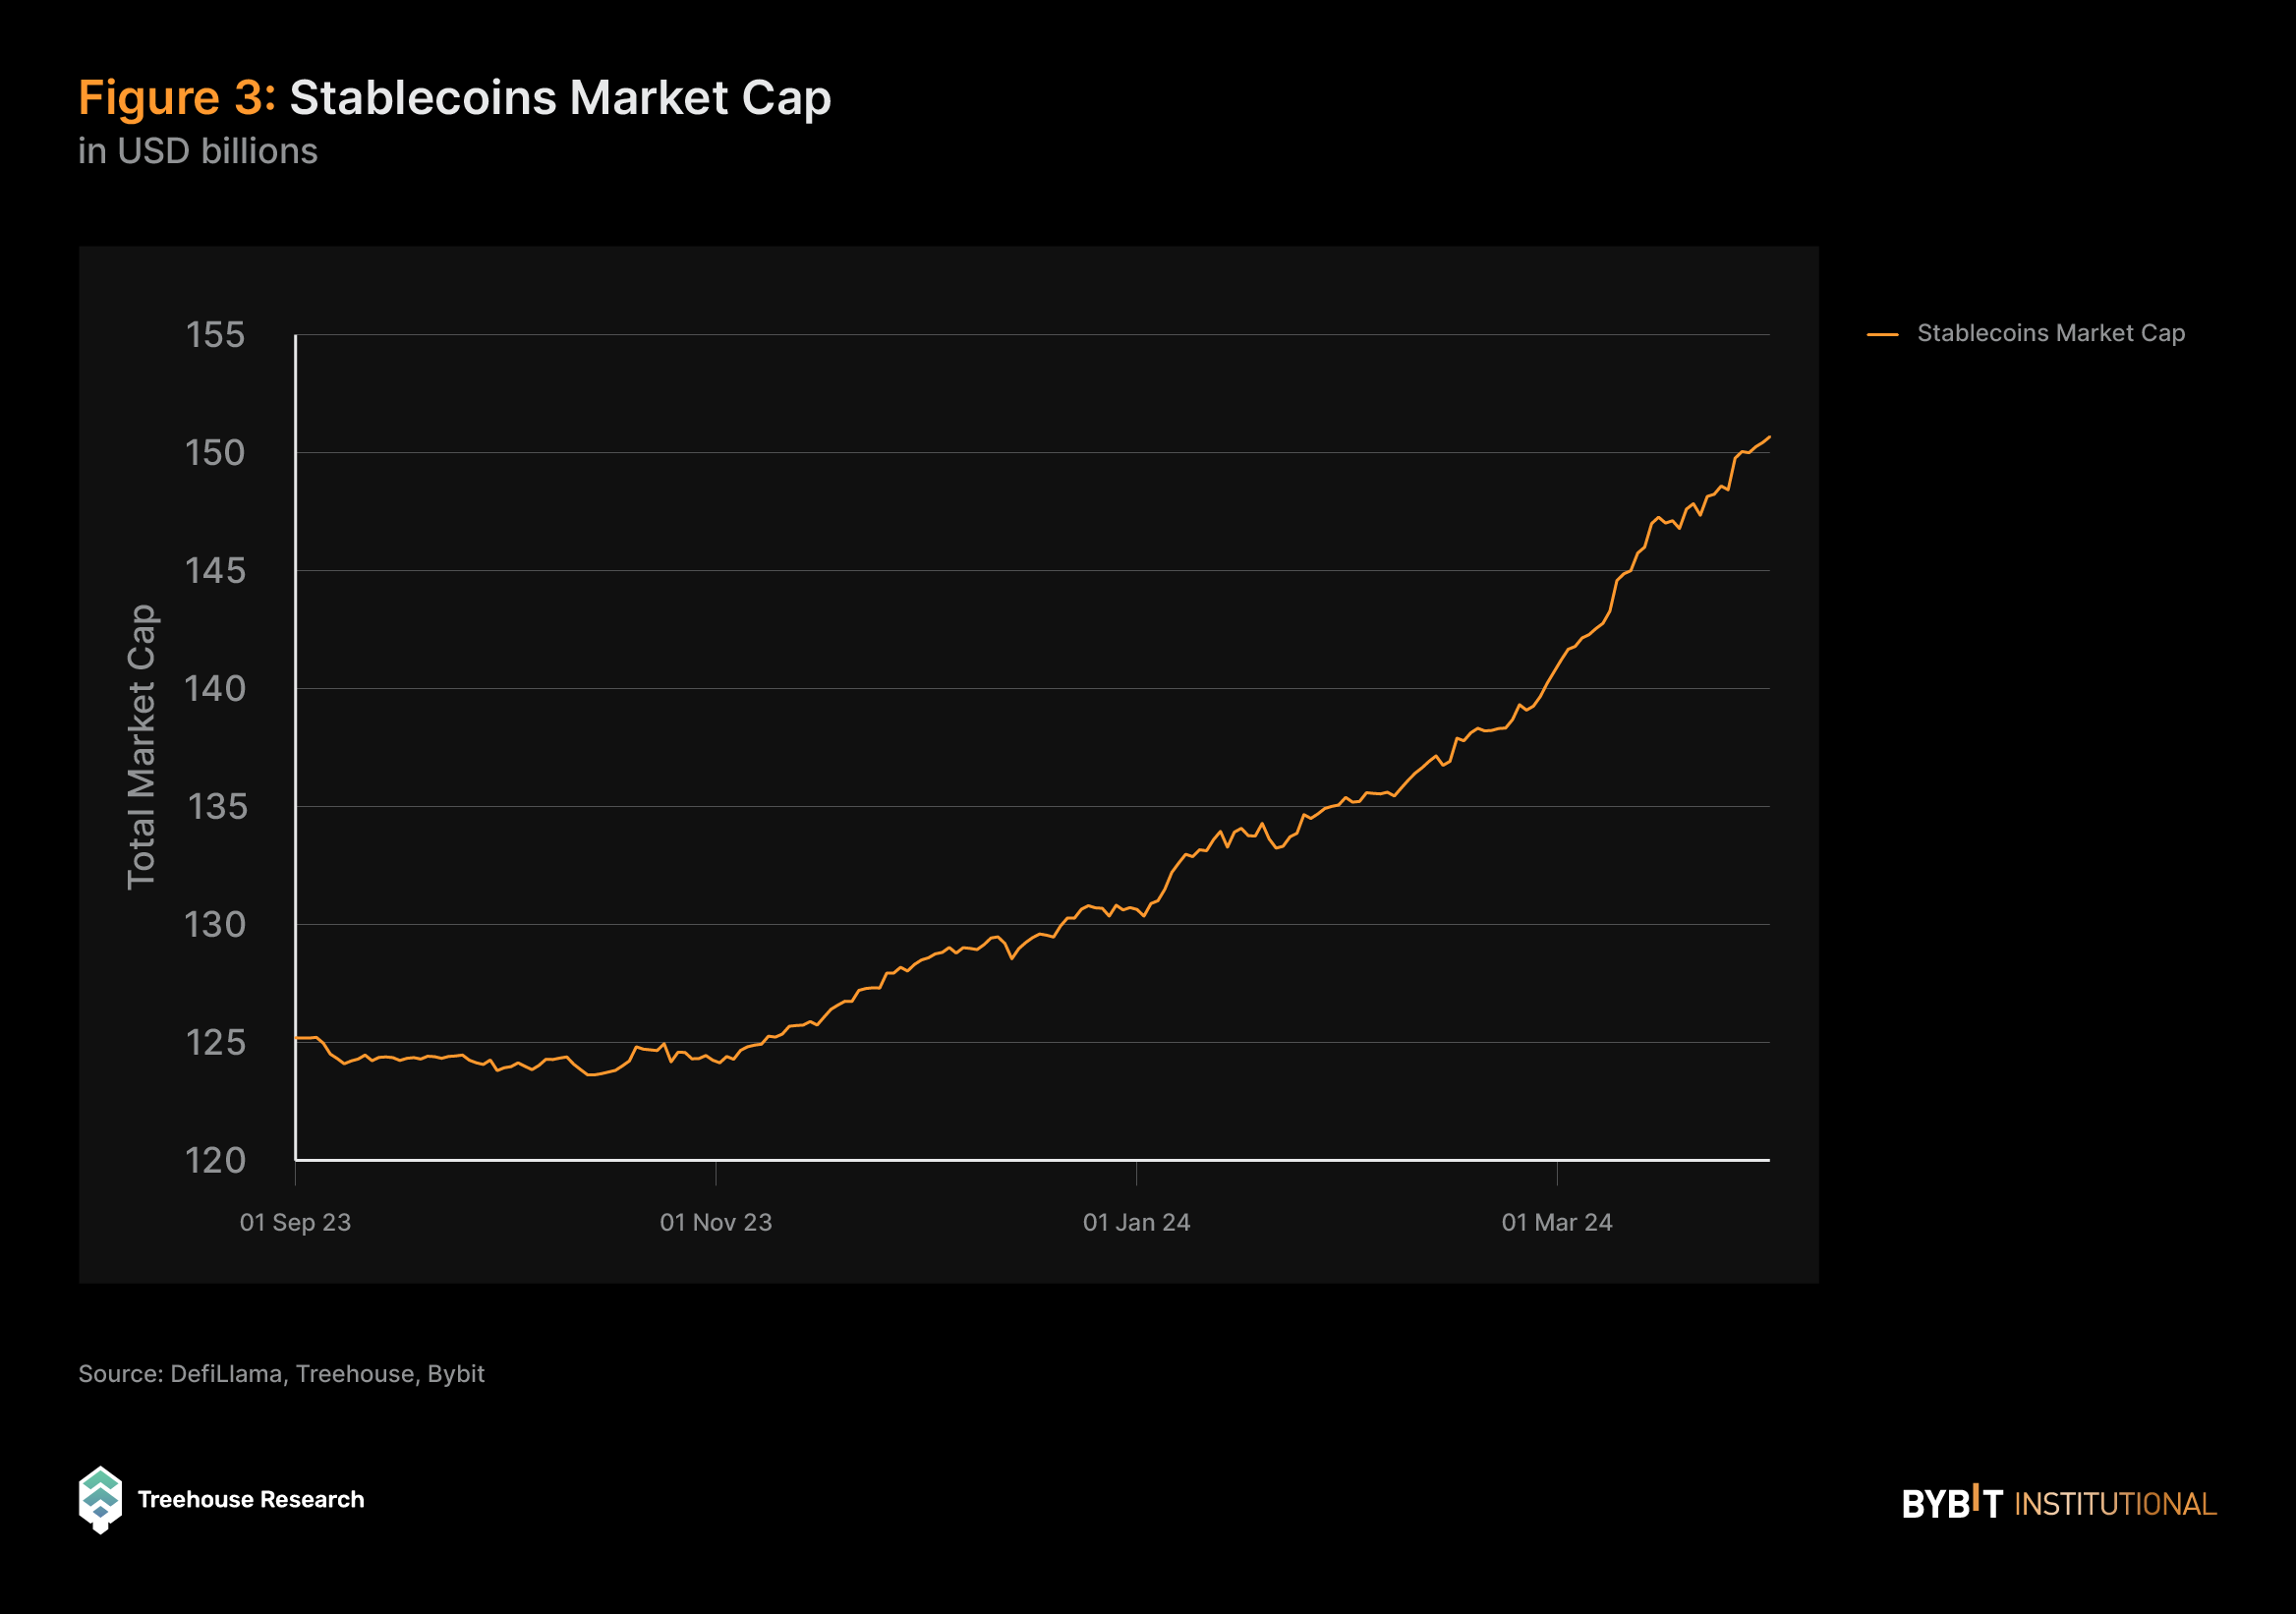
Specifically during this period, the total stablecoin market cap surged from approximately $125B to $150B by Mar 31, 2024, suggesting growing investor confidence and increased adoption of stablecoins as a preferred medium of exchange and store of value within the crypto markets.
Tether’s Increasing Dominance in the Stablecoin Market
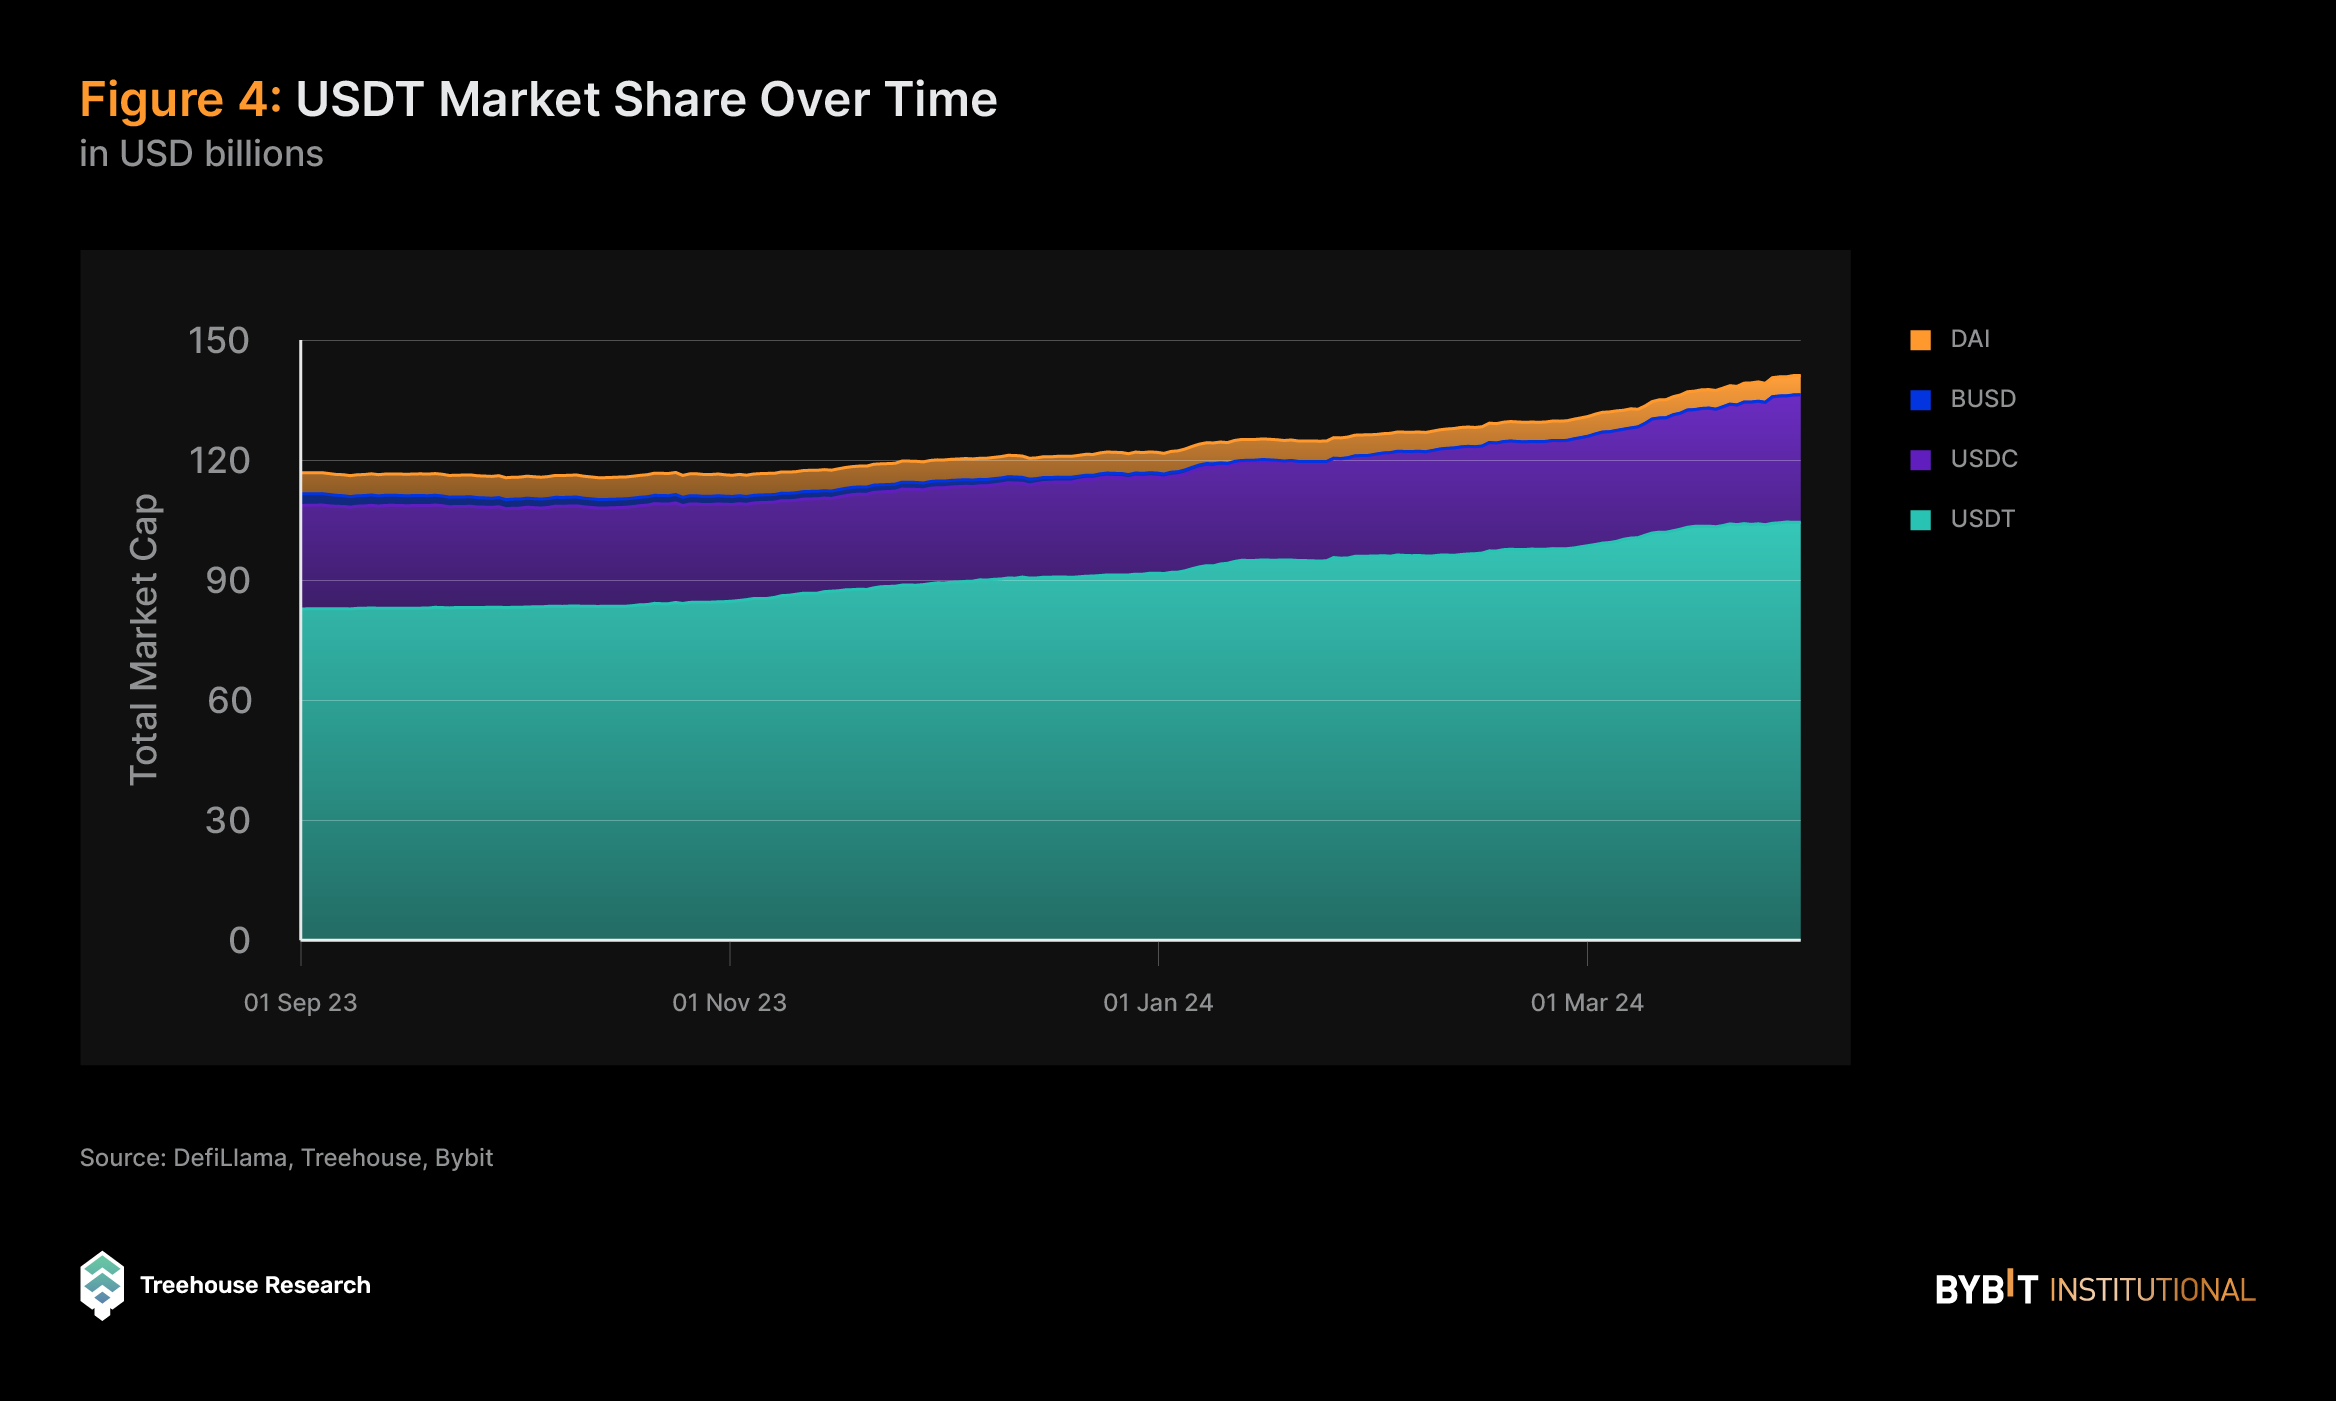
The dominance of USDT in the stablecoin market continues to increase over time, which suggests a degree of concentration risk, particularly following Circle’s Silicon Valley Bank incident earlier in 2023 which has deterred certain investors from using its USDC as a medium of exchange.
This concentration of market share in USDT raises concerns about potential systemic risks. Any liquidity issues, regulatory challenges, or loss of trust in USDT could have widespread repercussions, potentially leading to increased volatility and a loss of confidence in the broader cryptocurrency ecosystem. Therefore, diversification in stablecoin usage is crucial in order to mitigate risks and foster a more resilient digital asset economy.
Circle IPO: Pioneering Paths for Regulatory Compliance in Stablecoins
Circle, the company behind USDC, the popular stablecoin, has also confidentially initiated the process for an IPO in the U.S. This IPO awaits the completion of the SEC’s review, amid market uncertainties and various conditions.
The IPO would provide Circle with access to a larger pool of capital from public investors, which can be crucial for scaling operations, enhancing the USDC stablecoin infrastructure and investing in new projects or technology to stay competitive in the rapidly evolving cryptocurrency sector. By becoming a publicly traded company, Circle also aims to enhance its credibility and legitimacy in the financial world and attract more traditional investors, who might be hesitant to engage with cryptocurrencies.
Moreover, Circle’s IPO acts as a catalyst for increased institutional interest and investment in the cryptocurrency space, highlighting the potential for crypto-related businesses to operate within regulatory frameworks. The trend set by Circle could also inspire other stablecoin issuers to pursue similar paths toward regulatory compliance and transparency.
Crypto as the Perfect TradFi Hedge
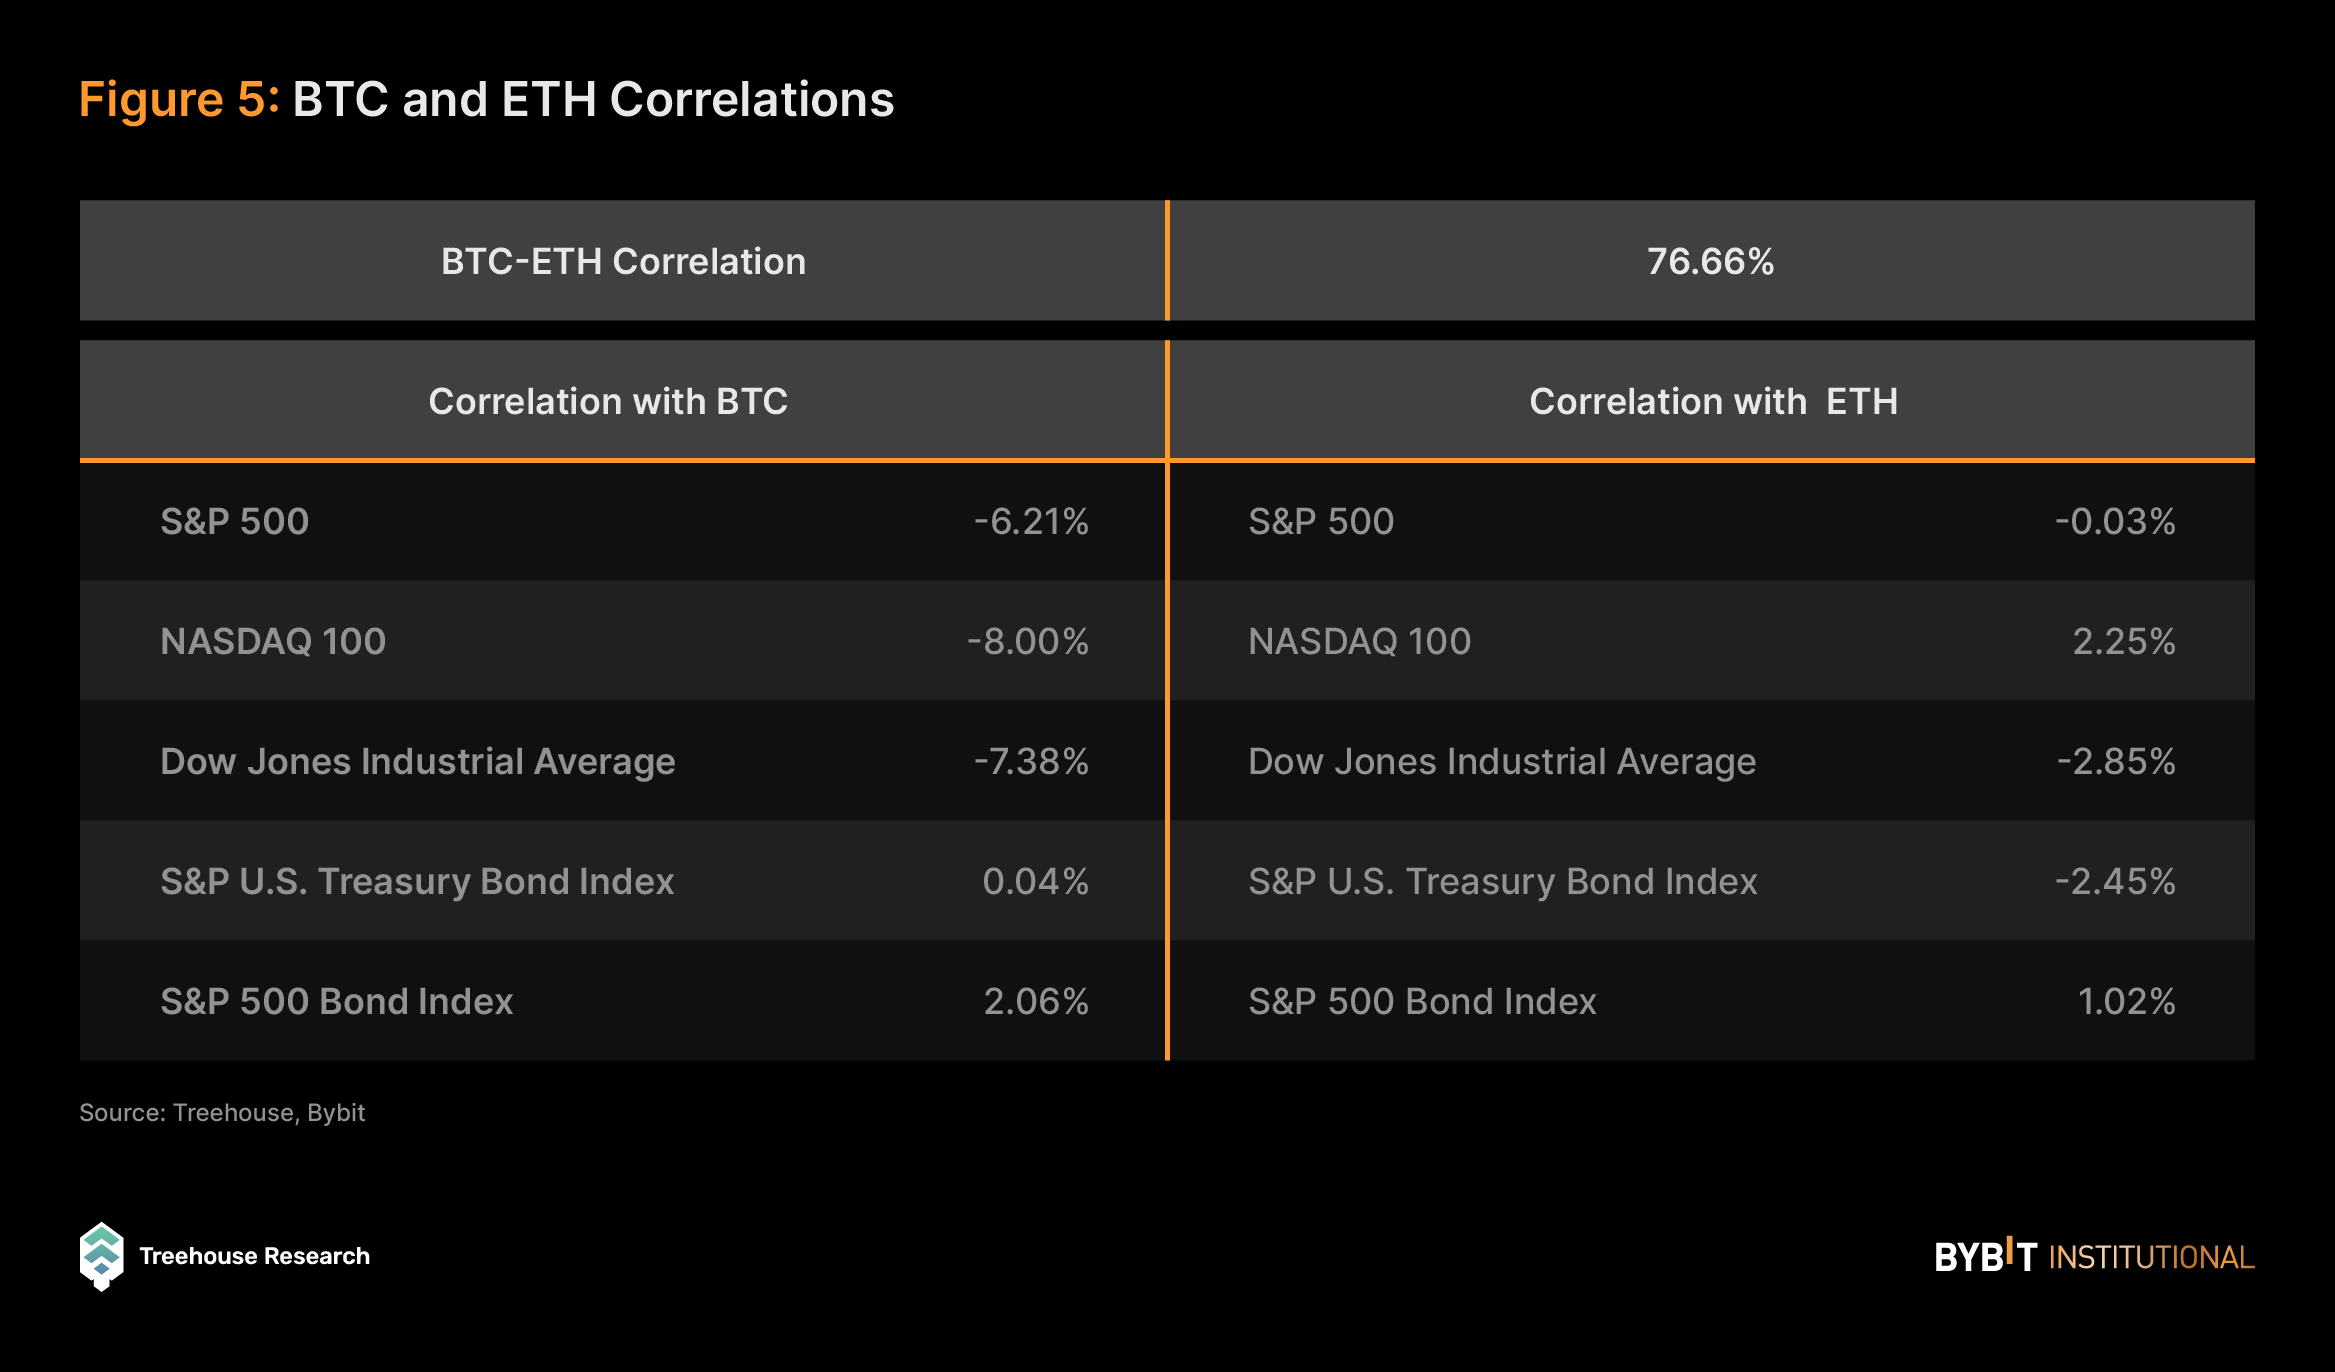
BTC and ETH continue to exhibit extremely high correlations, with the two crypto heavyweights moving closely against one another and effectively acting as the benchmark for the entire crypto market. However, both of them have low correlations with traditional indices, equity, or fixed income, remaining below 3% in all instances.
Of particular note, BTC specifically demonstrates negative correlations of returns with major equity indices, indicating its potential role as a diversification hedge for equity-focused portfolios.
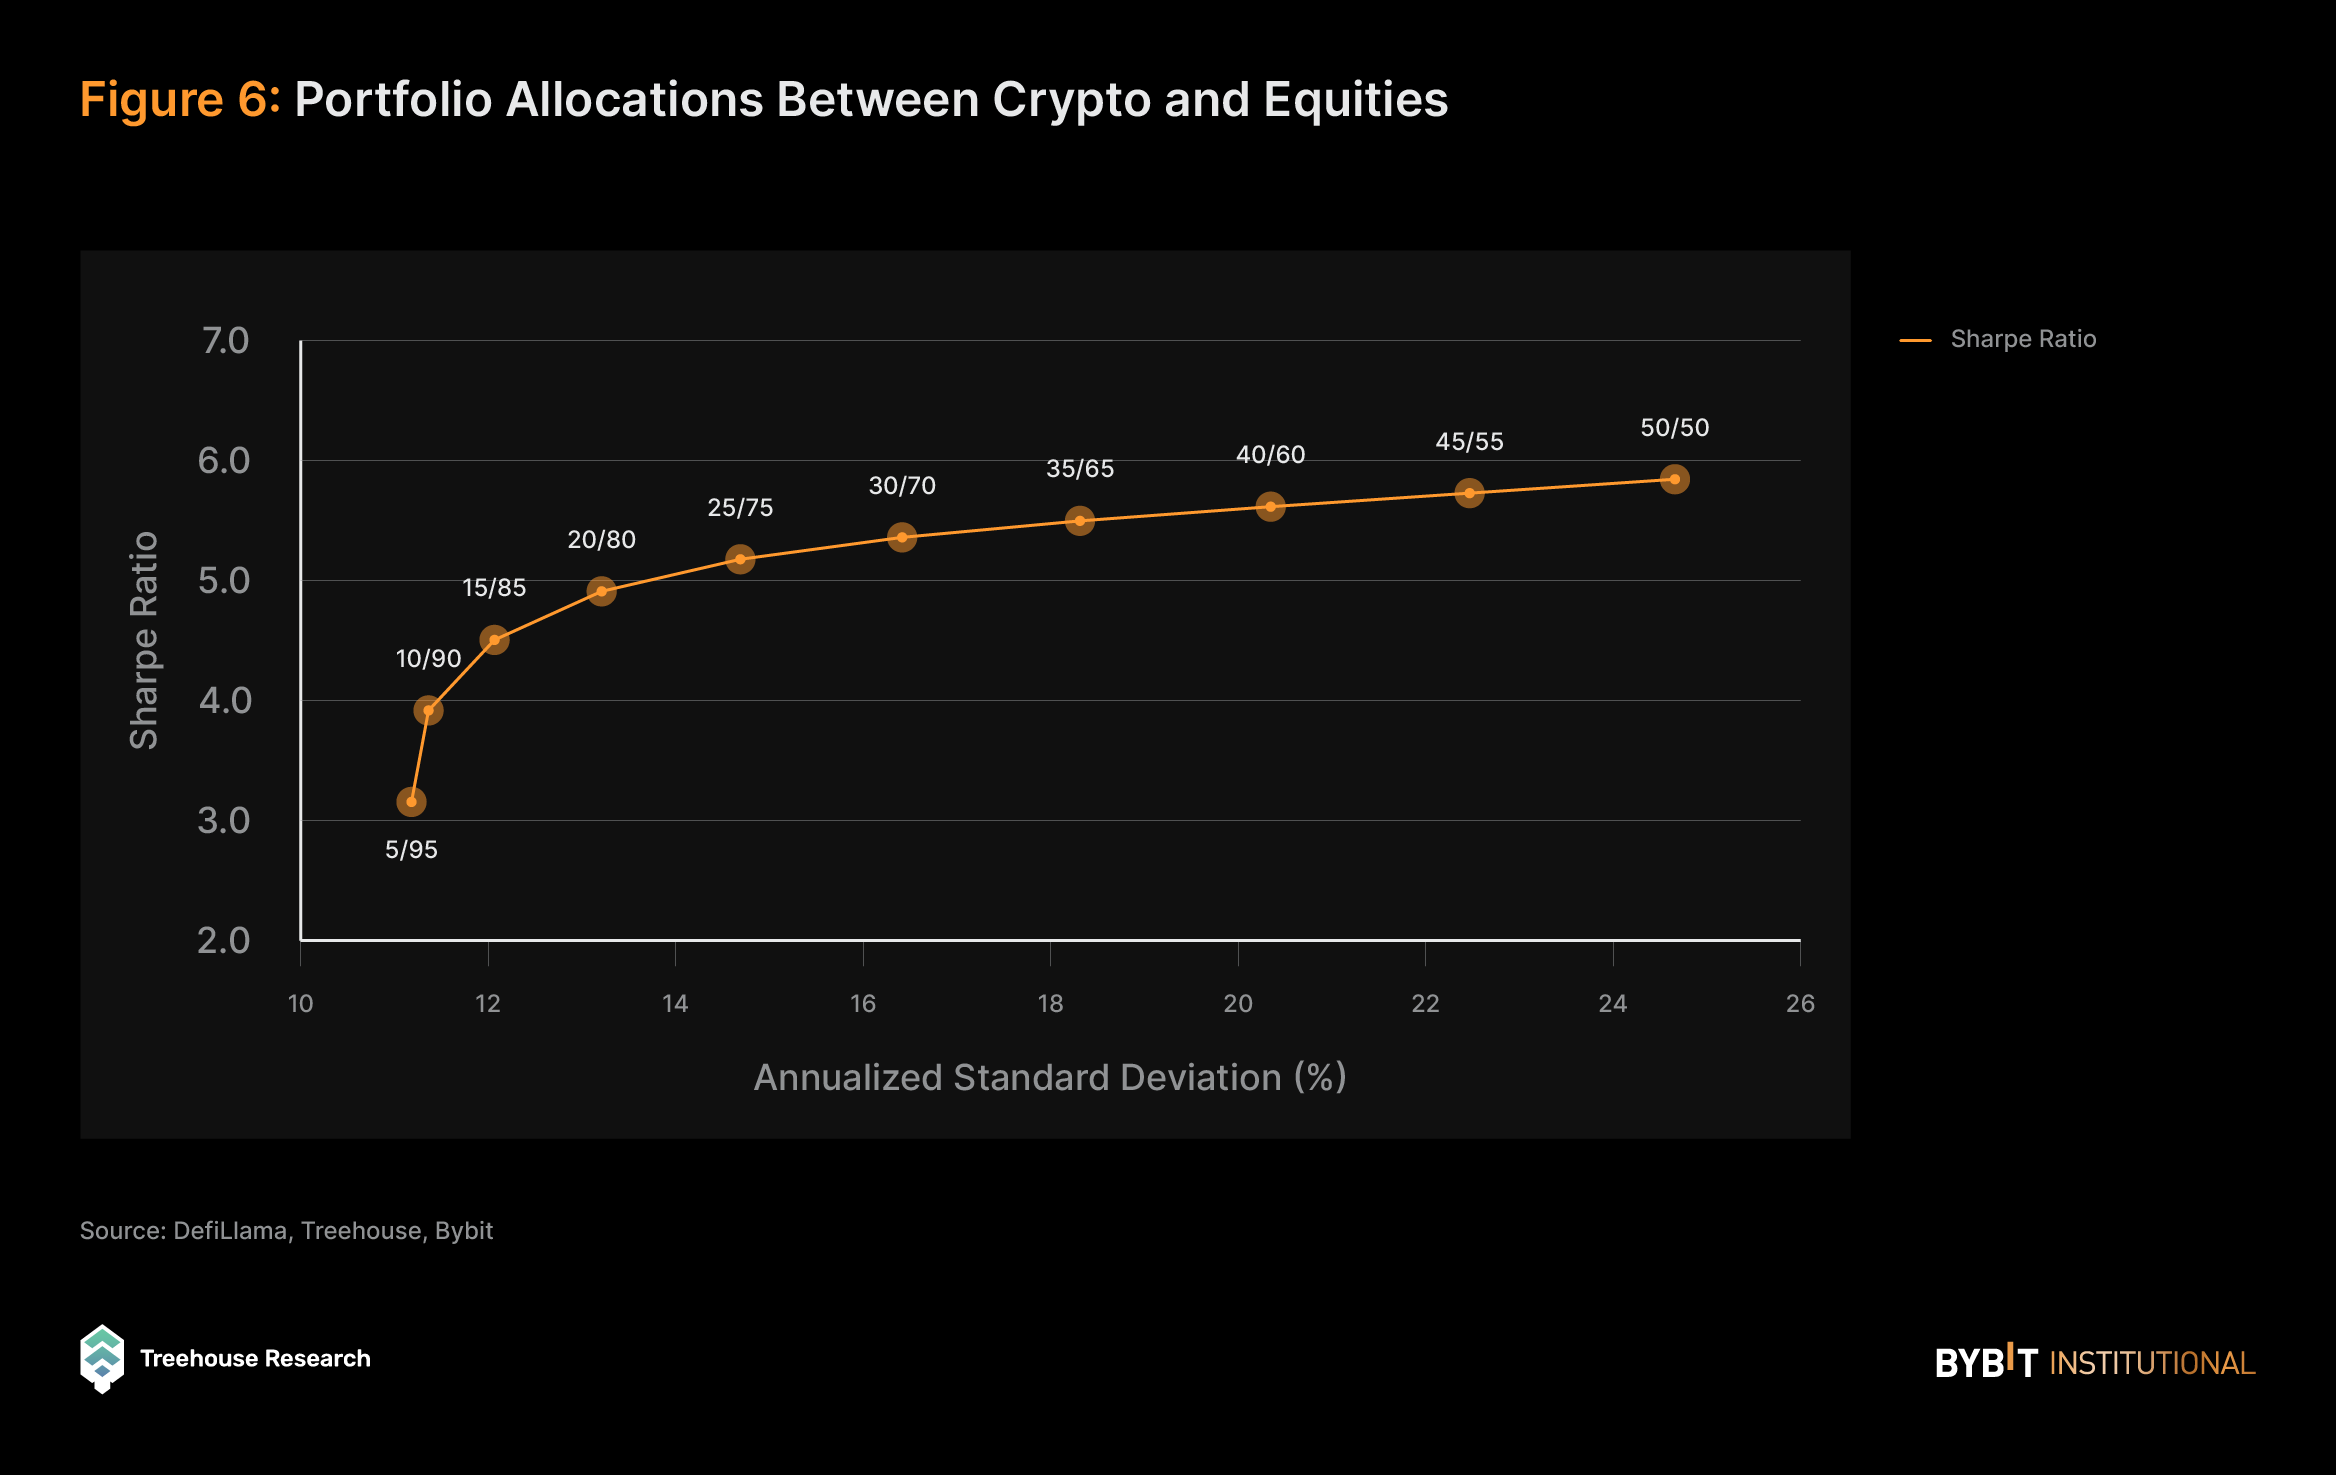
To illustrate this effect, consider the S&P 500 as a representation of a well-diversified investor in the equities market. Adding crypto to their portfolio could significantly enhance risk-adjusted returns, as calculated with the Sharpe ratio.
With a modest 5% allocation into BTC and ETH (equally weighted), the S&P 500’s Sharpe ratio can be increased from 2.20 to 3.15, representing a 43.6% increase. This effect becomes more pronounced as investors willingly take on additional risks and allocate more capital to their crypto portfolios.
However, the most prominent diversification effort to enhance risk-adjusted returns occurs when allocating 15% or less into crypto. Beyond this threshold, the diminishing effect on portfolio diversification becomes more apparent.
At a 50/50 split between equities and crypto, the Sharpe ratio reaches 5.85, only slightly below that of the crypto portfolio built with equal allocations of BTC and ETH at 7.61. Remarkably, this portfolio would have experienced approximately half of the risks as compared to the crypto portfolio alone, with a standard deviation of 24.66% as compared to 48.20%.
Meteoric Rise of the Crypto Market Cap
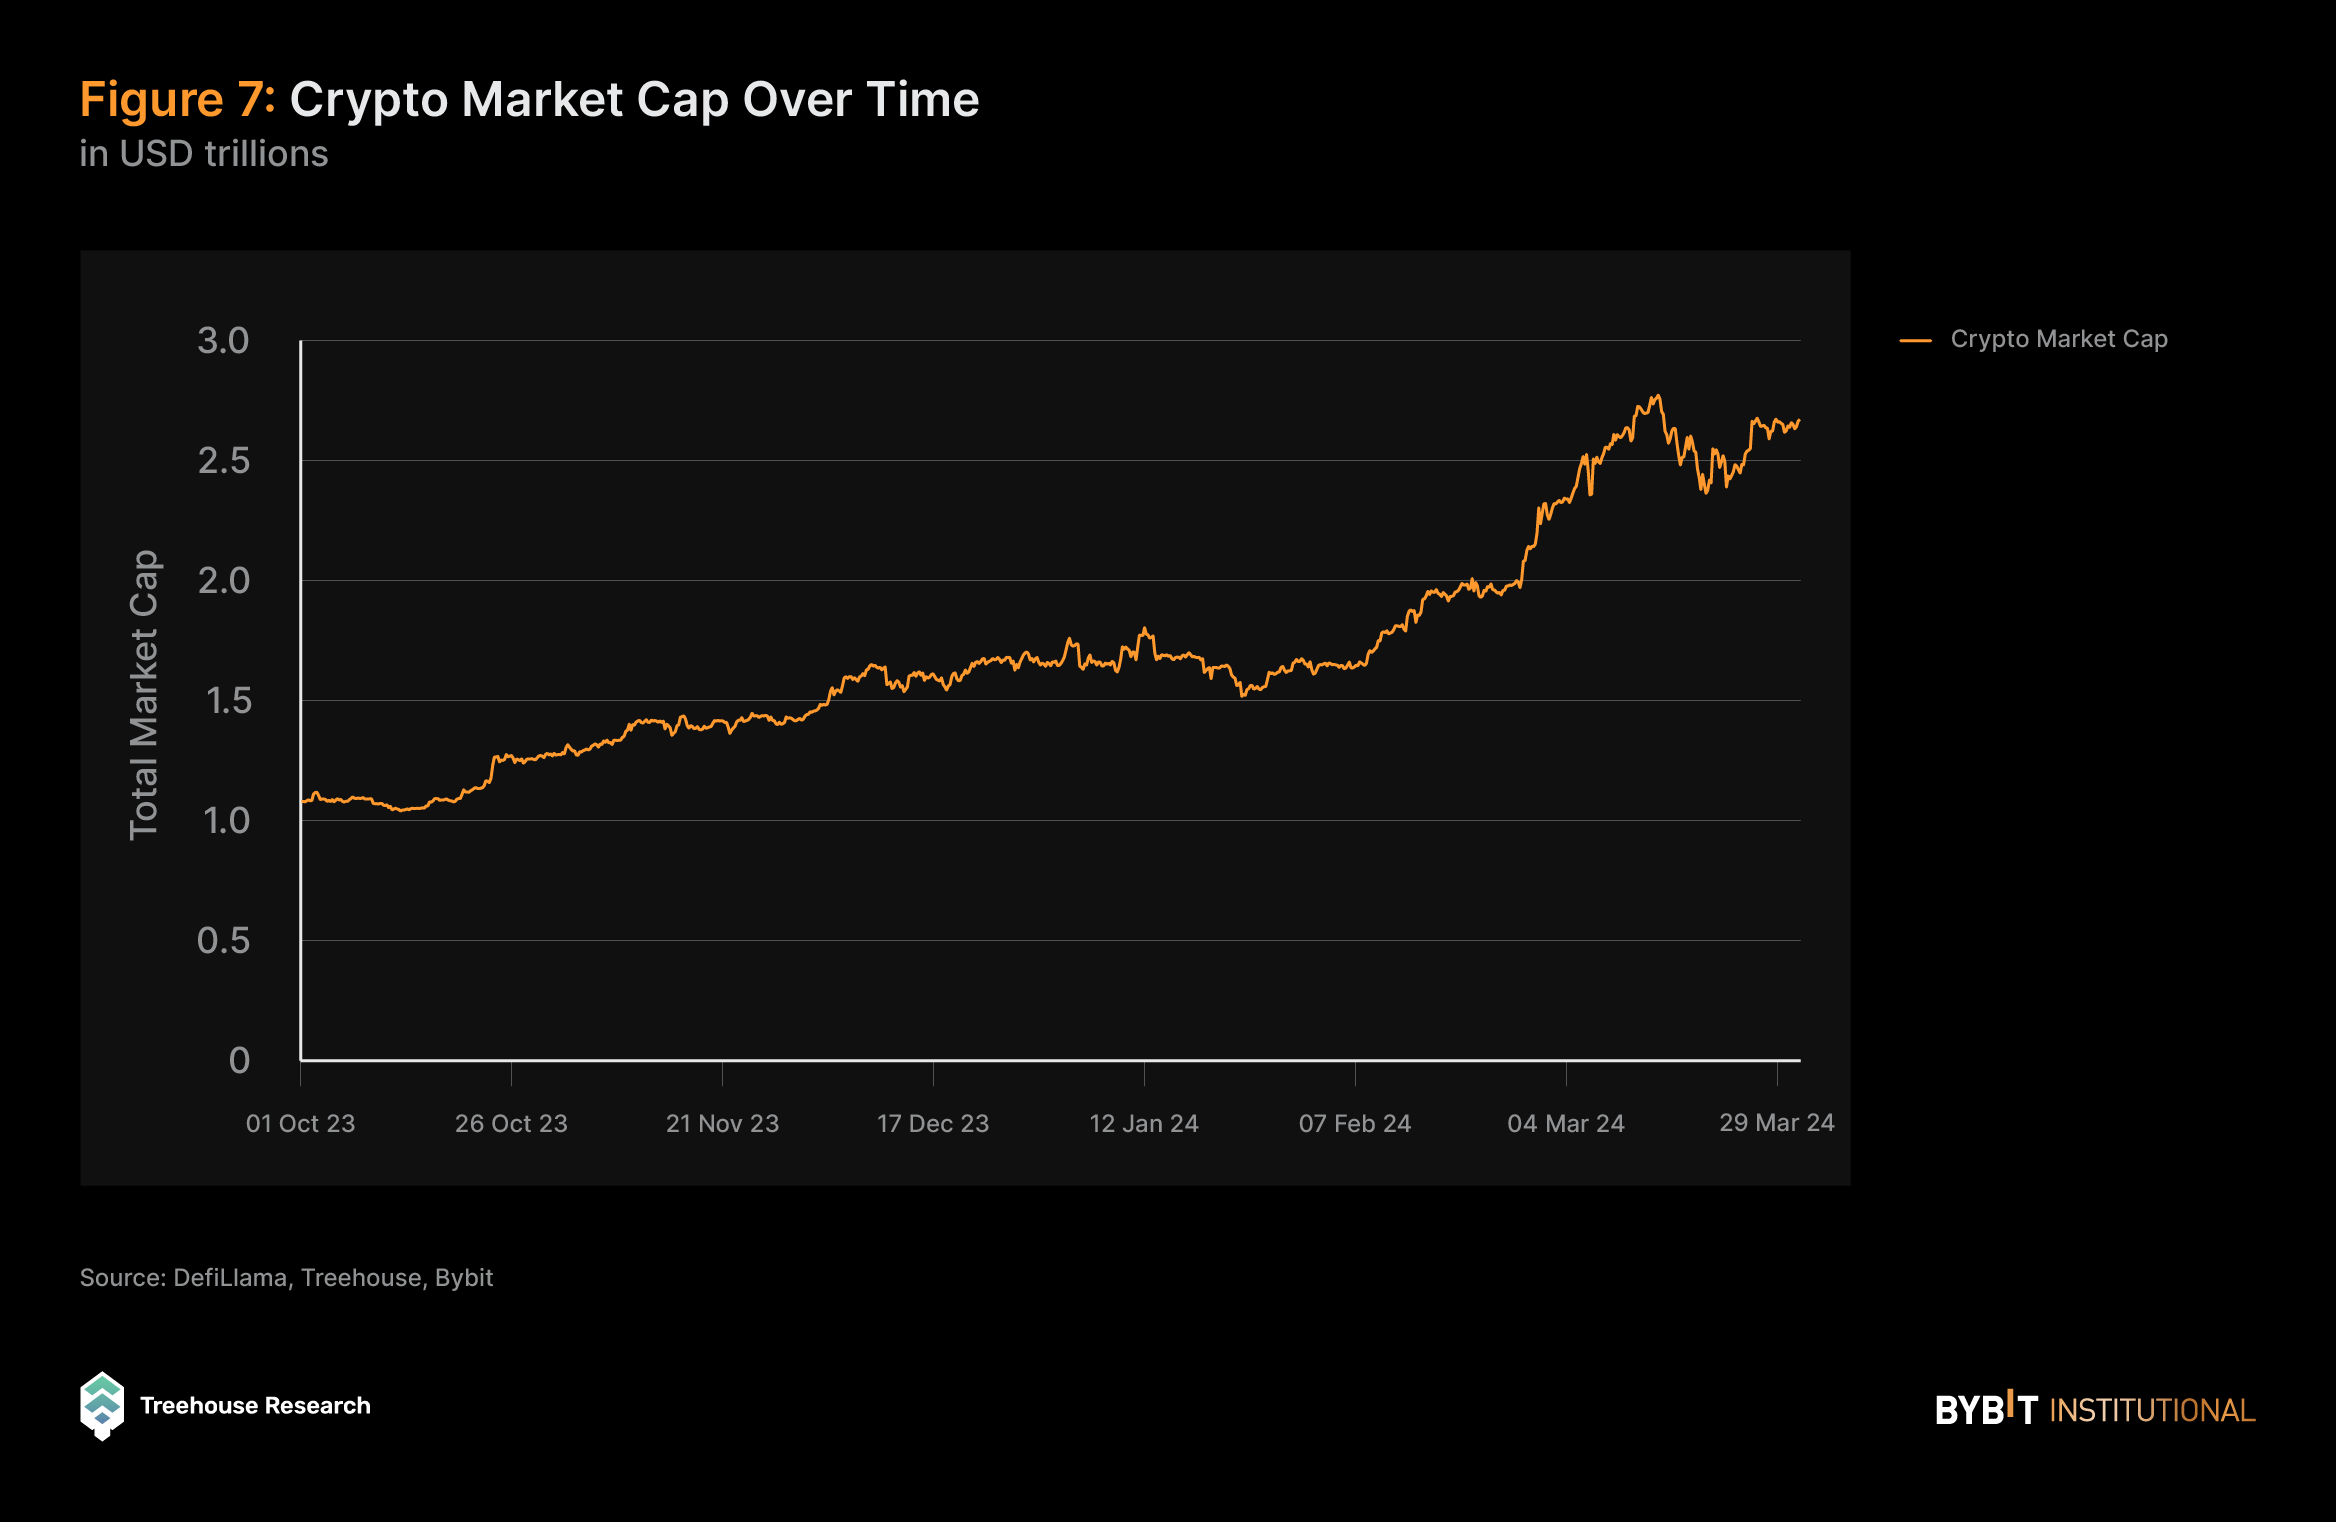
Over the observed period, the overall crypto sector witnessed a formidable escalation in value. This trajectory, marked by its robust upward momentum, highlighted investor confidence and the infusion of capital within the crypto ecosystem.
Such a surge aligns with the wider themes observed in the previous quarter, during which factors such as macroeconomic stabilization, regulatory clarifications, and consequential shifts in institutional strategies came together to buoy the market.
Crypto Adoption Gains Momentum
Geographically, the epicenter of cryptocurrency adoption and innovation has shifted toward Central and Southeast Asia, revealing a critical aspect of crypto adoption and its ability to thrive in varied economic landscapes. India, China and the U.S., on the other hand, have the highest absolute numbers of crypto users, though relatively few when compared to their respective populations.
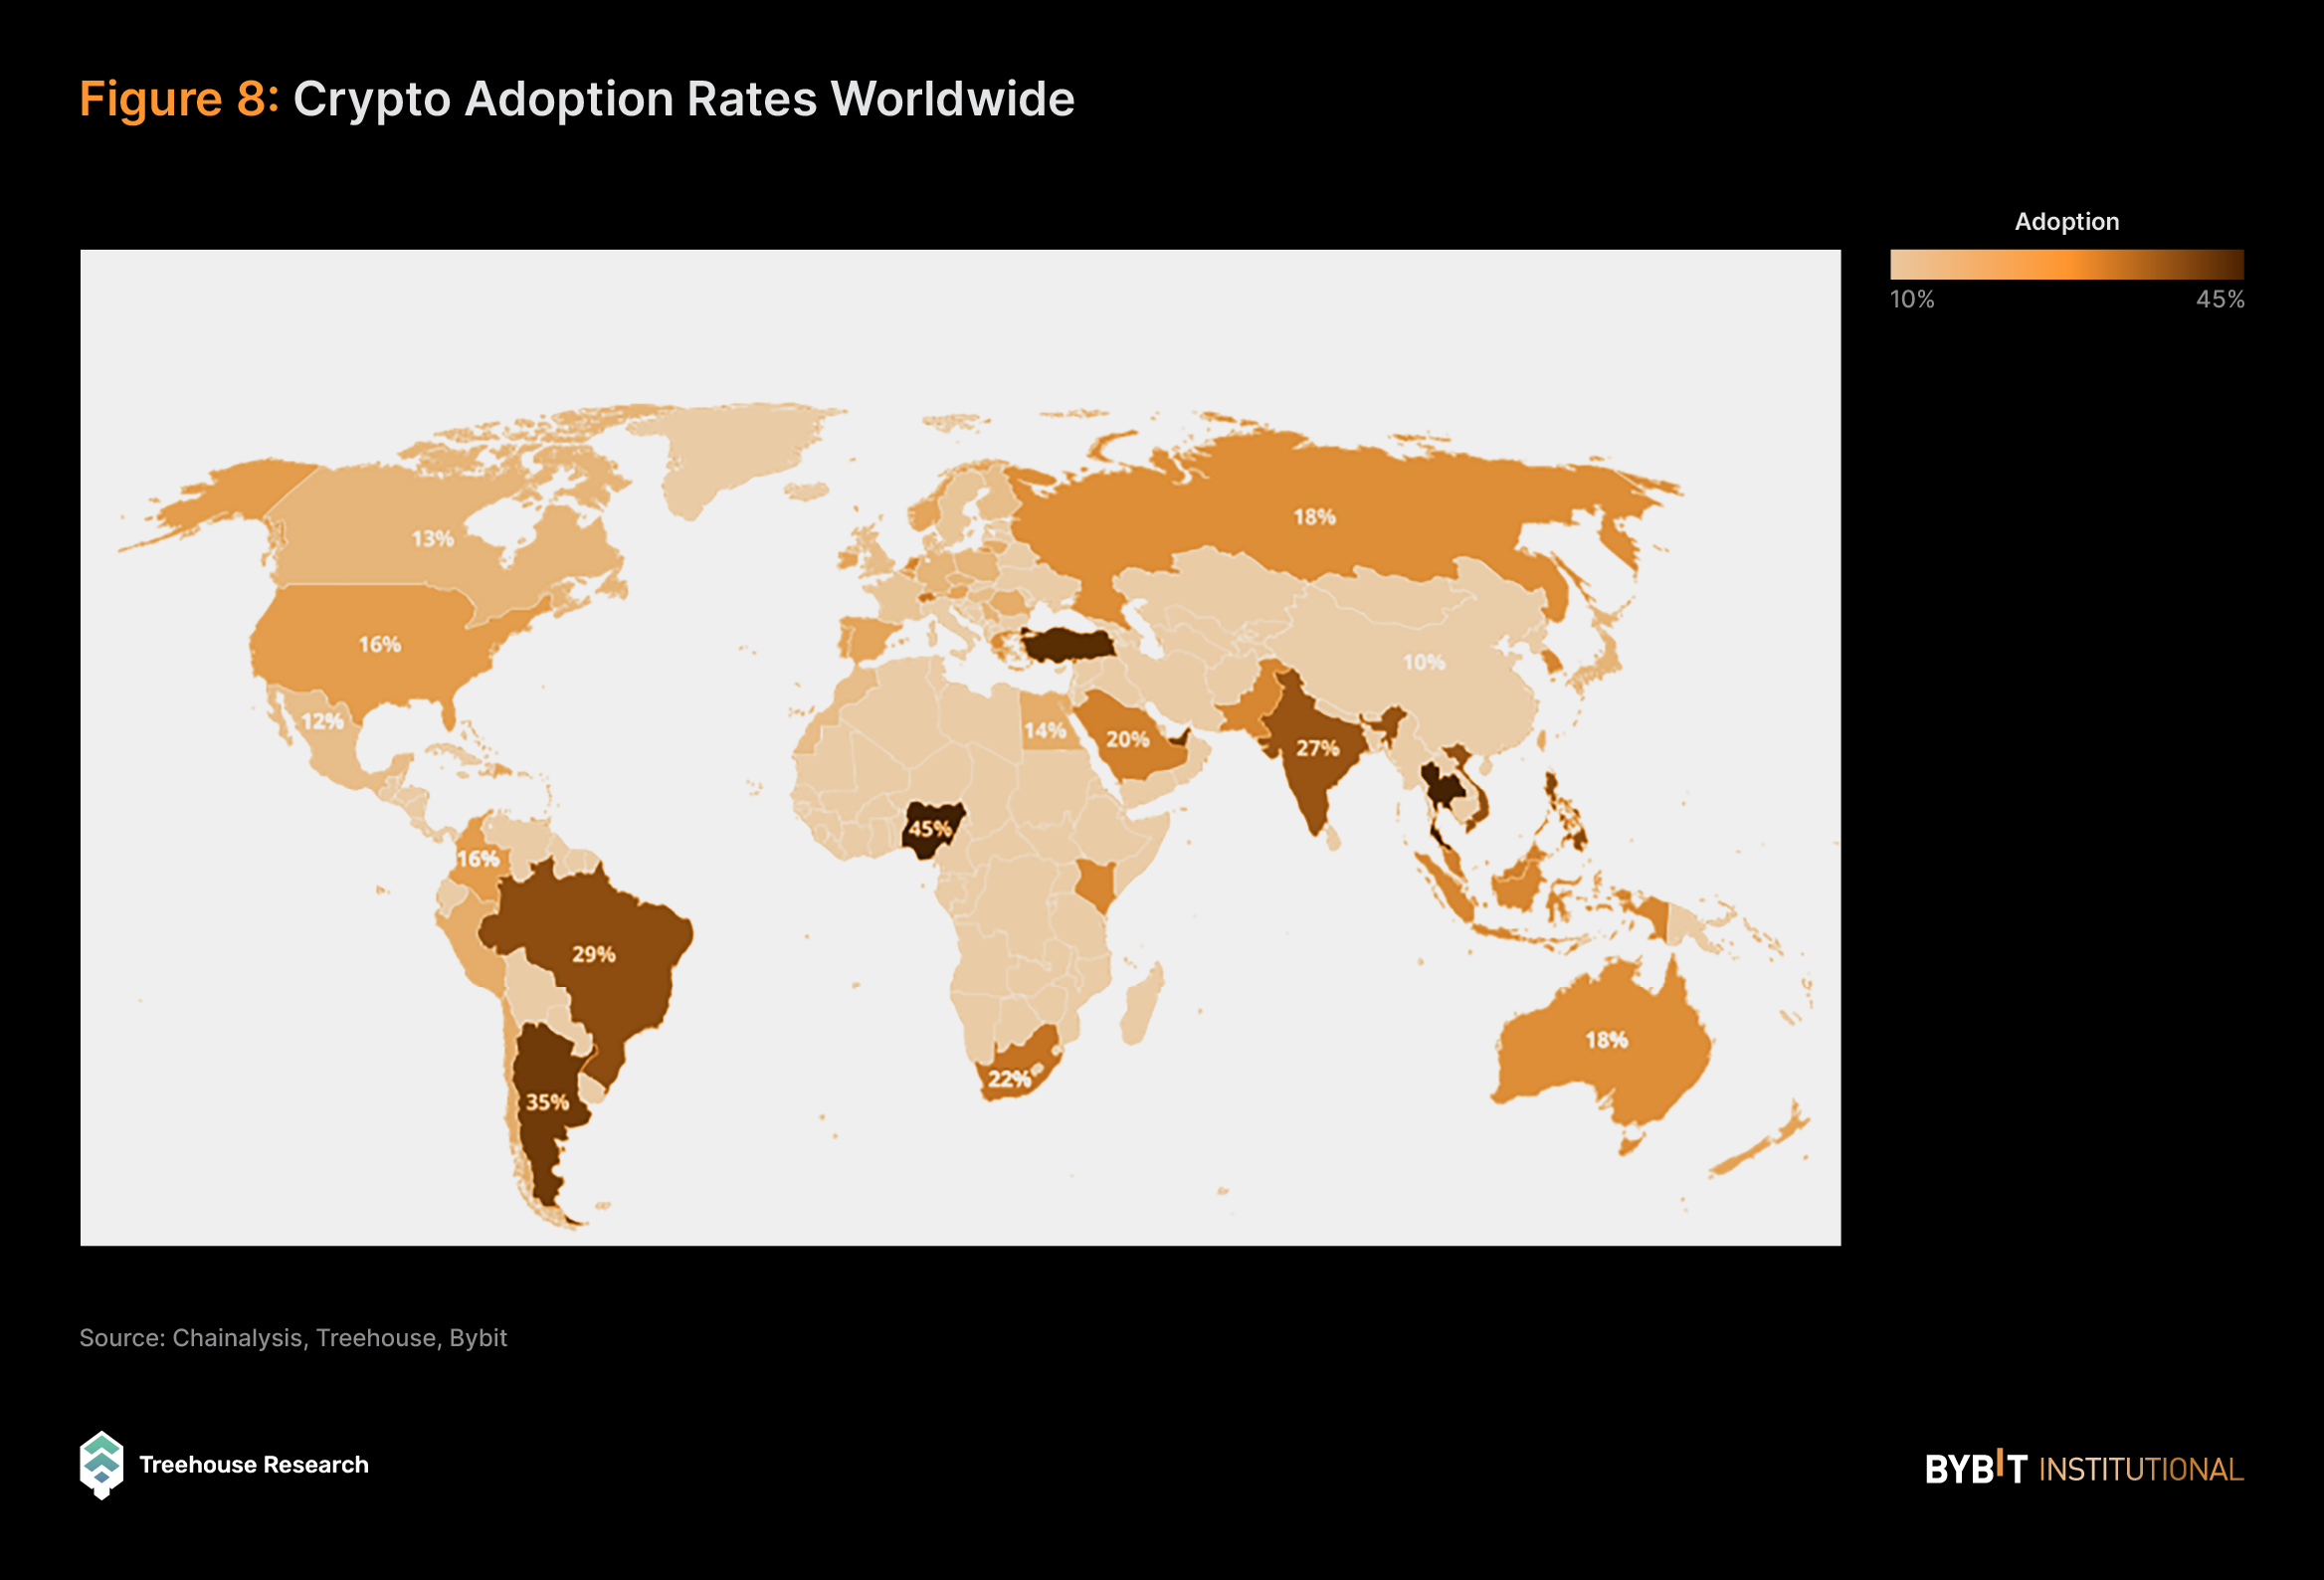
The Chainalysis 2023 Global Crypto Adoption Index shows the prominence of grassroots cryptocurrency adoption across the globe, particularly spotlighting average individuals over large transaction volumes by integrating on-chain and real-world data through five sub-indexes (total and retail value received at centralized exchanges, peer-to-peer exchange volume, and total and retail value received from DeFi protocols), adjusted by purchasing power parity and internet user metrics to show the crypto economic impact per country. Central & Southern Asia and Oceania (CSAO) emerge as front-runners, with India leading the pack, followed by nations such as Nigeria, Vietnam, and the United States.
Grassroots adoption in the Latin American region is strong, with three countries ranking in the top 20 in the Global Crypto Adoption Index: Brazil, Argentina, and Mexico. The methodology suggests crypto activity’s relative significance to each country’s economic backdrop, highlighting its influence on everyday lives. Despite a global downturn in crypto adoption noted since late 2022, countries are still witnessing a resilient recovery of adoption.
A Market Dominated By Male Youngsters
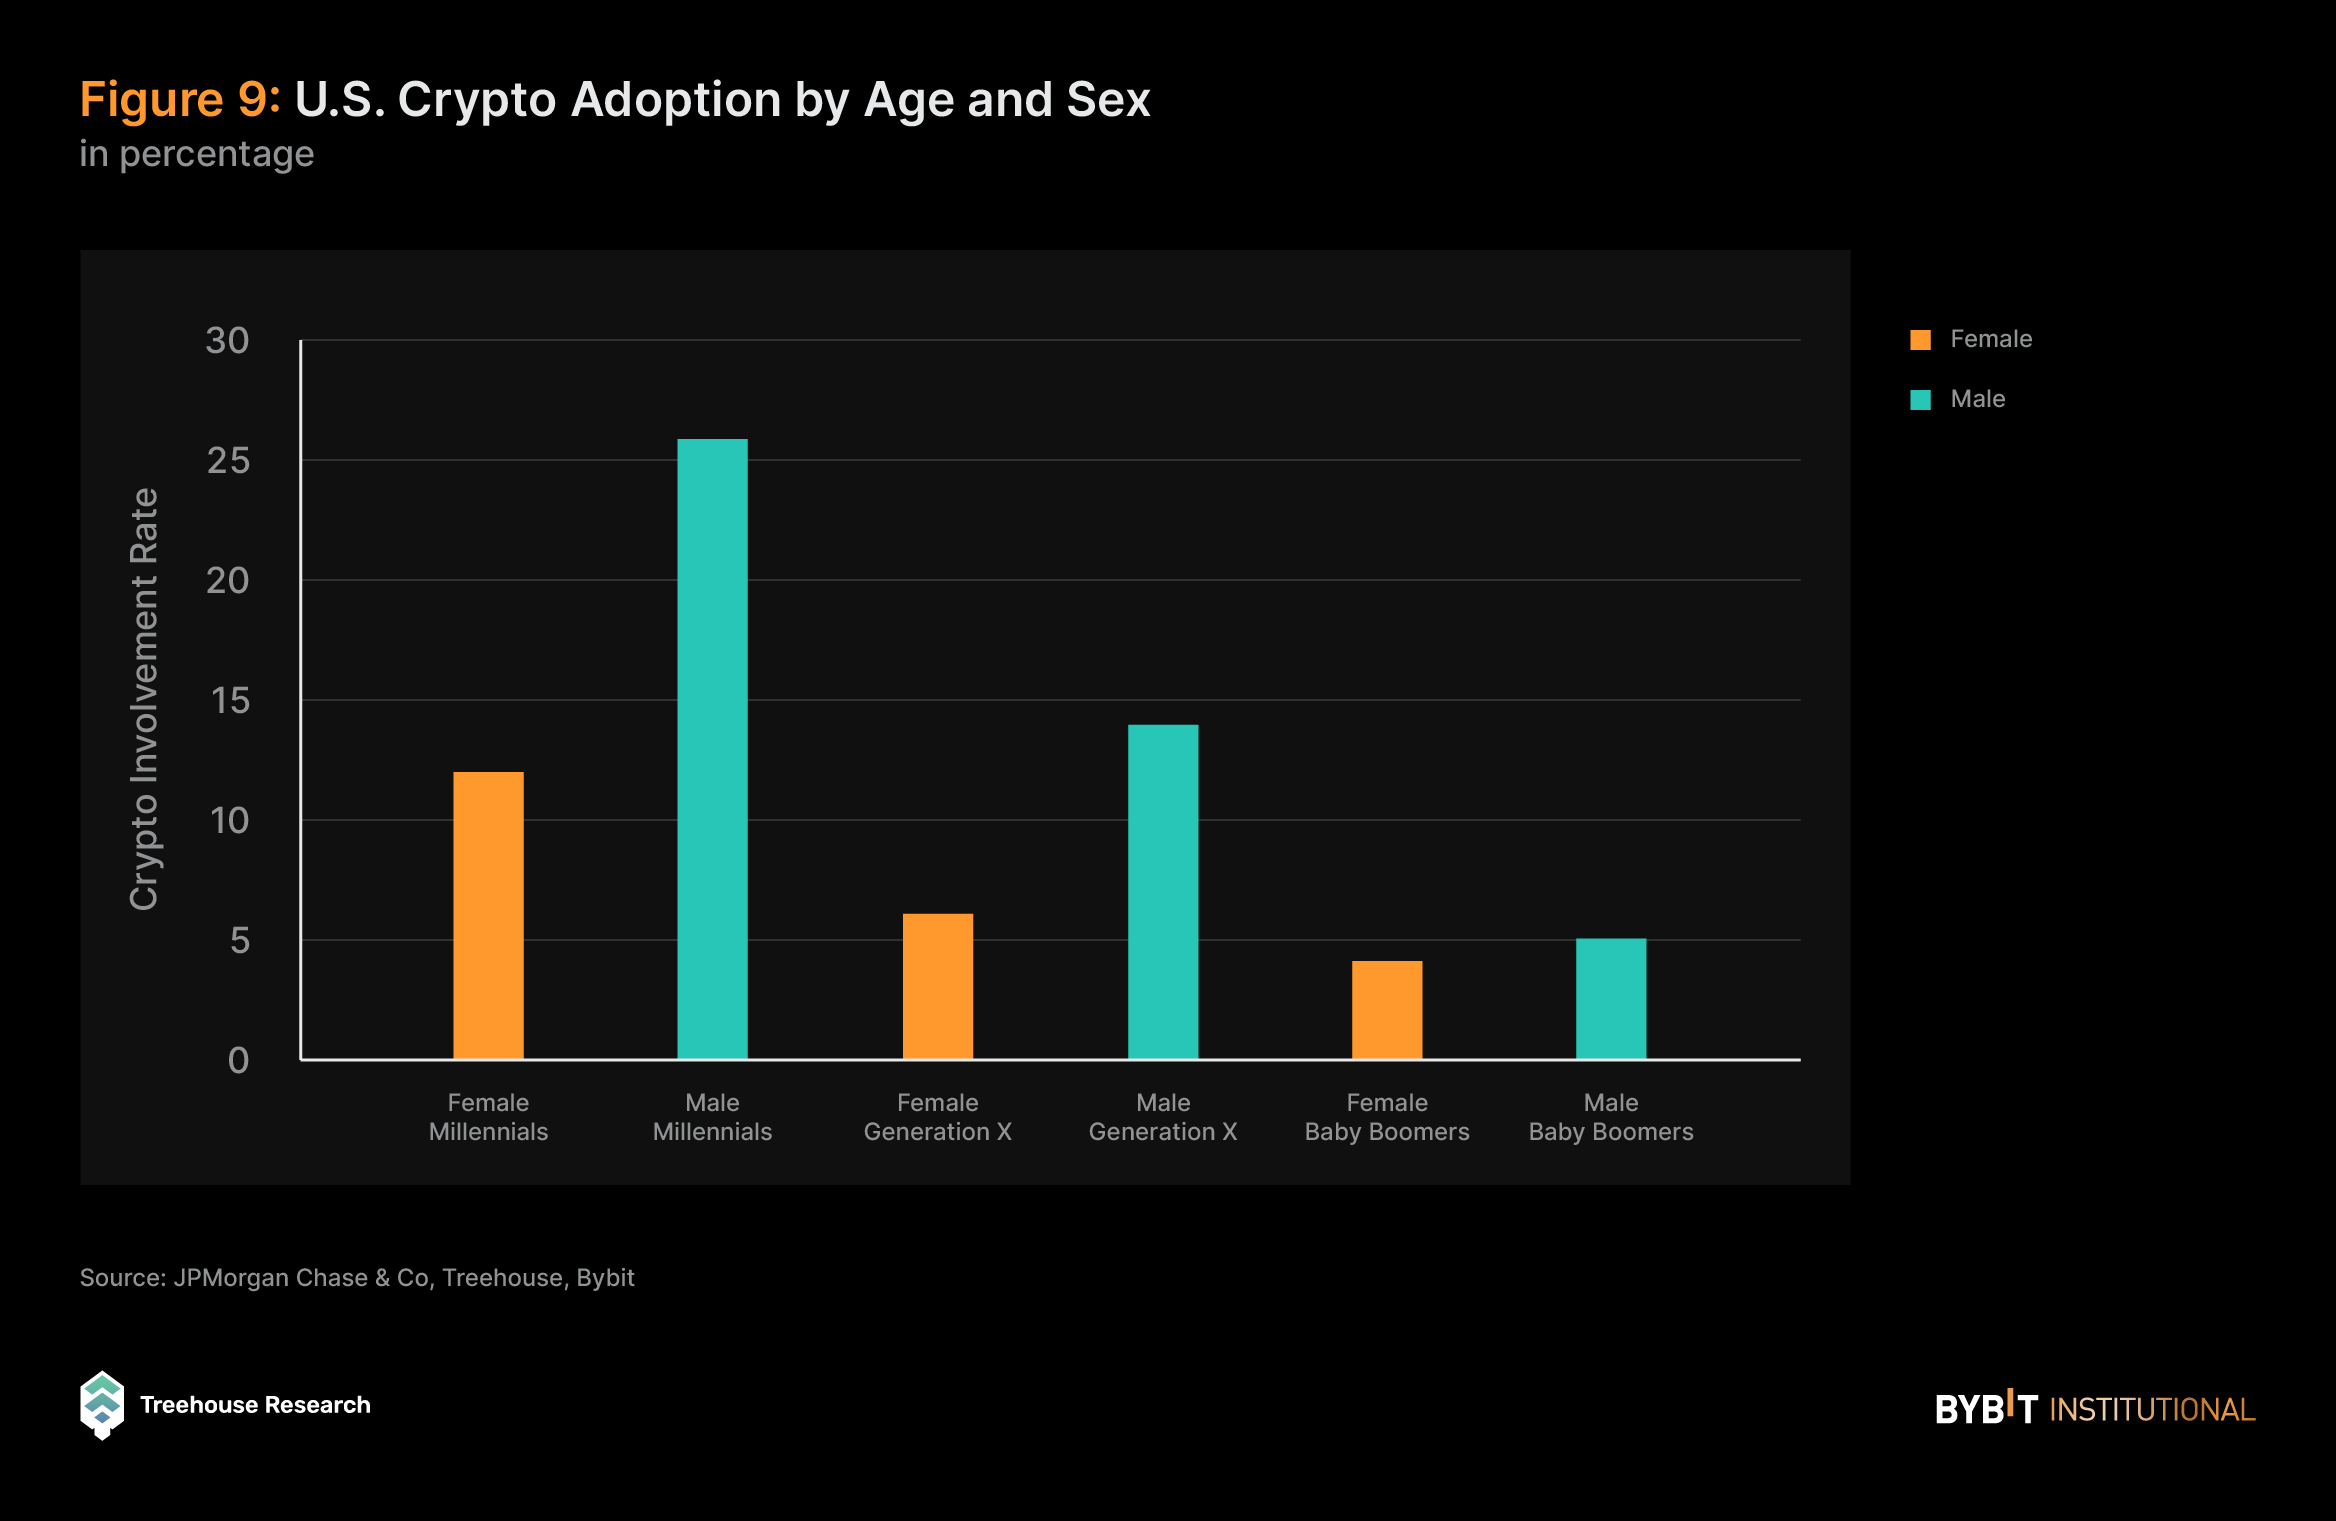
In December 2022, JPM’s analysis in the U.S. revealed a significant correlation between age and gender and the adoption of cryptocurrency, with millennials leading in usage at 20%, followed by Generation X at 11% and baby boomers at 4%. This trend is further accentuated by gender, with men approximately twice as likely to engage in transactions involving cryptocurrency accounts across all age groups.
Rising BTC Dominance: Implications for the Altcoin Surge Ahead
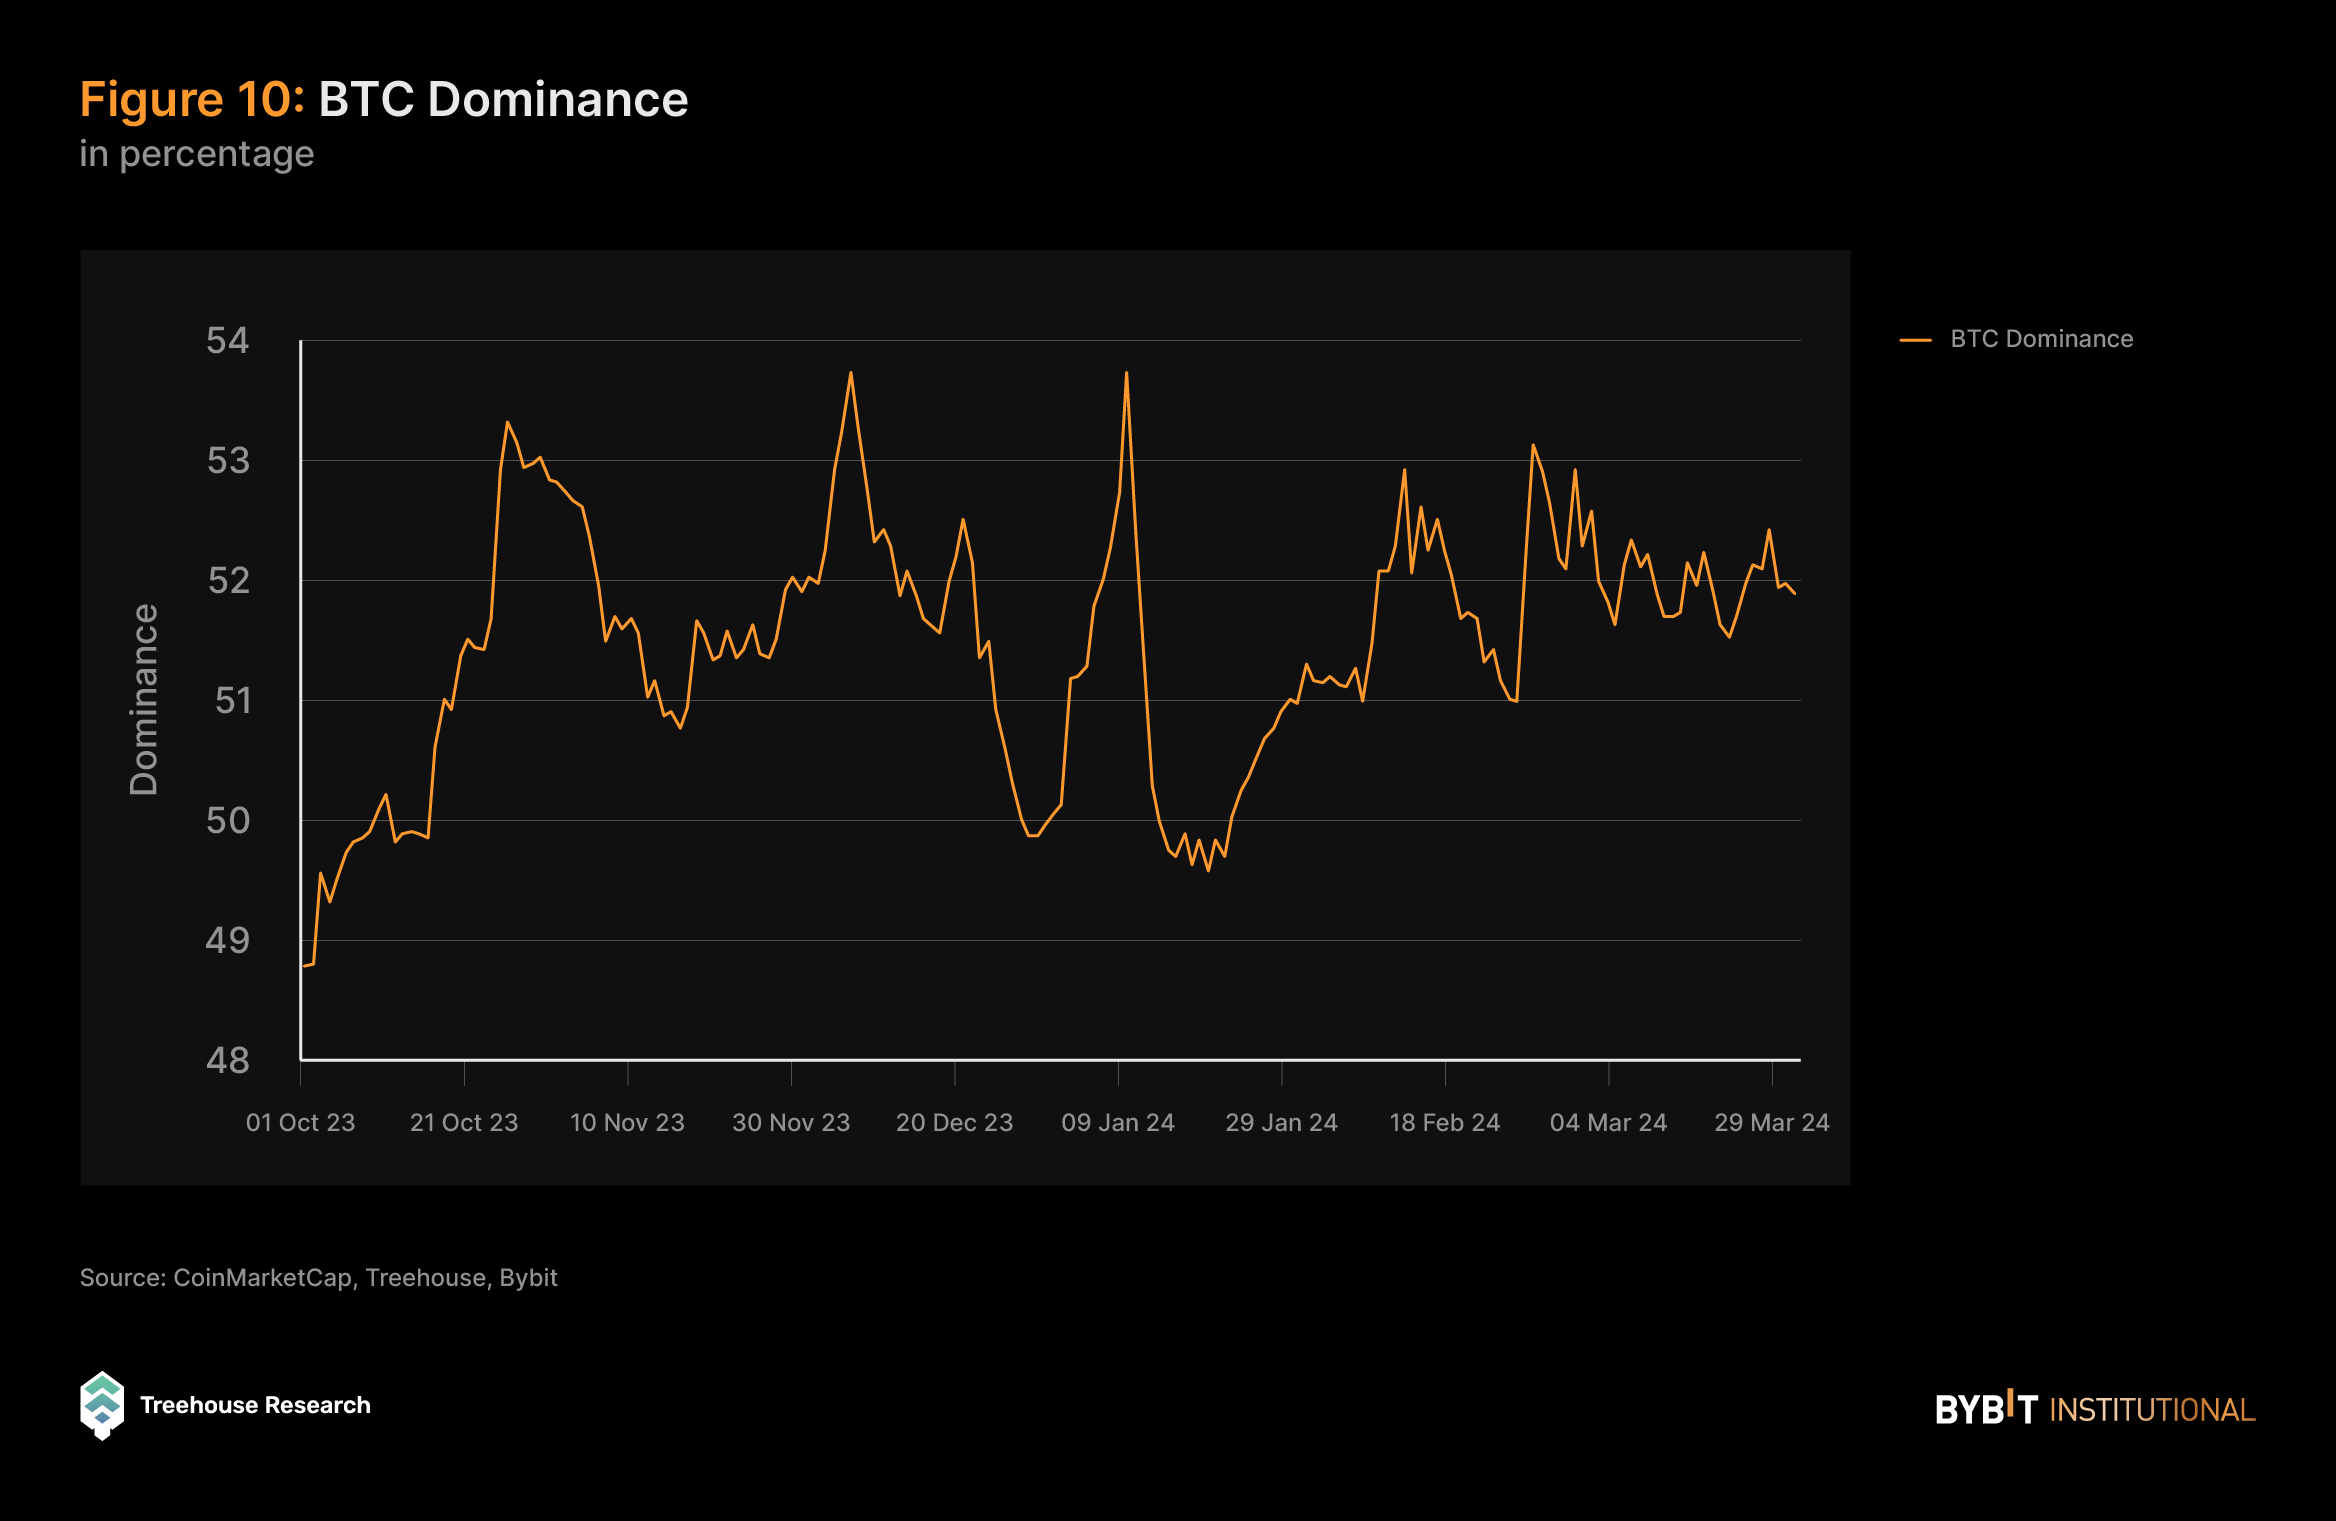
BTC dominance has been steadily rising since October 1, 2023, climbing from 48.79% to a peak of 53.76% on Jan 10, 2024. This upward trend can be attributed to several factors, including increased institutional interest in Bitcoin ETFs, which were approved by the SEC on the same day. Additionally, BTC has benefited from other bullish narratives during this period, such as speculation surrounding the Runes protocol to enhance the BRC-20 token standard, and announcements from major companies such as PayPal and Mastercard to bolster their support for cryptocurrency transactions.
This shift in Bitcoin dominance could signal a corresponding change in market dynamics, with some investors, particularly retail traders, potentially taking profits from their BTC positions to pursue higher-risk opportunities. Such sentiment aligns with prevailing bullish market conditions, characterized by the steady increase in the total crypto market cap and Bitcoin’s price appreciation throughout the period.
Spot and Derivatives Market Shares
Spot CEXs
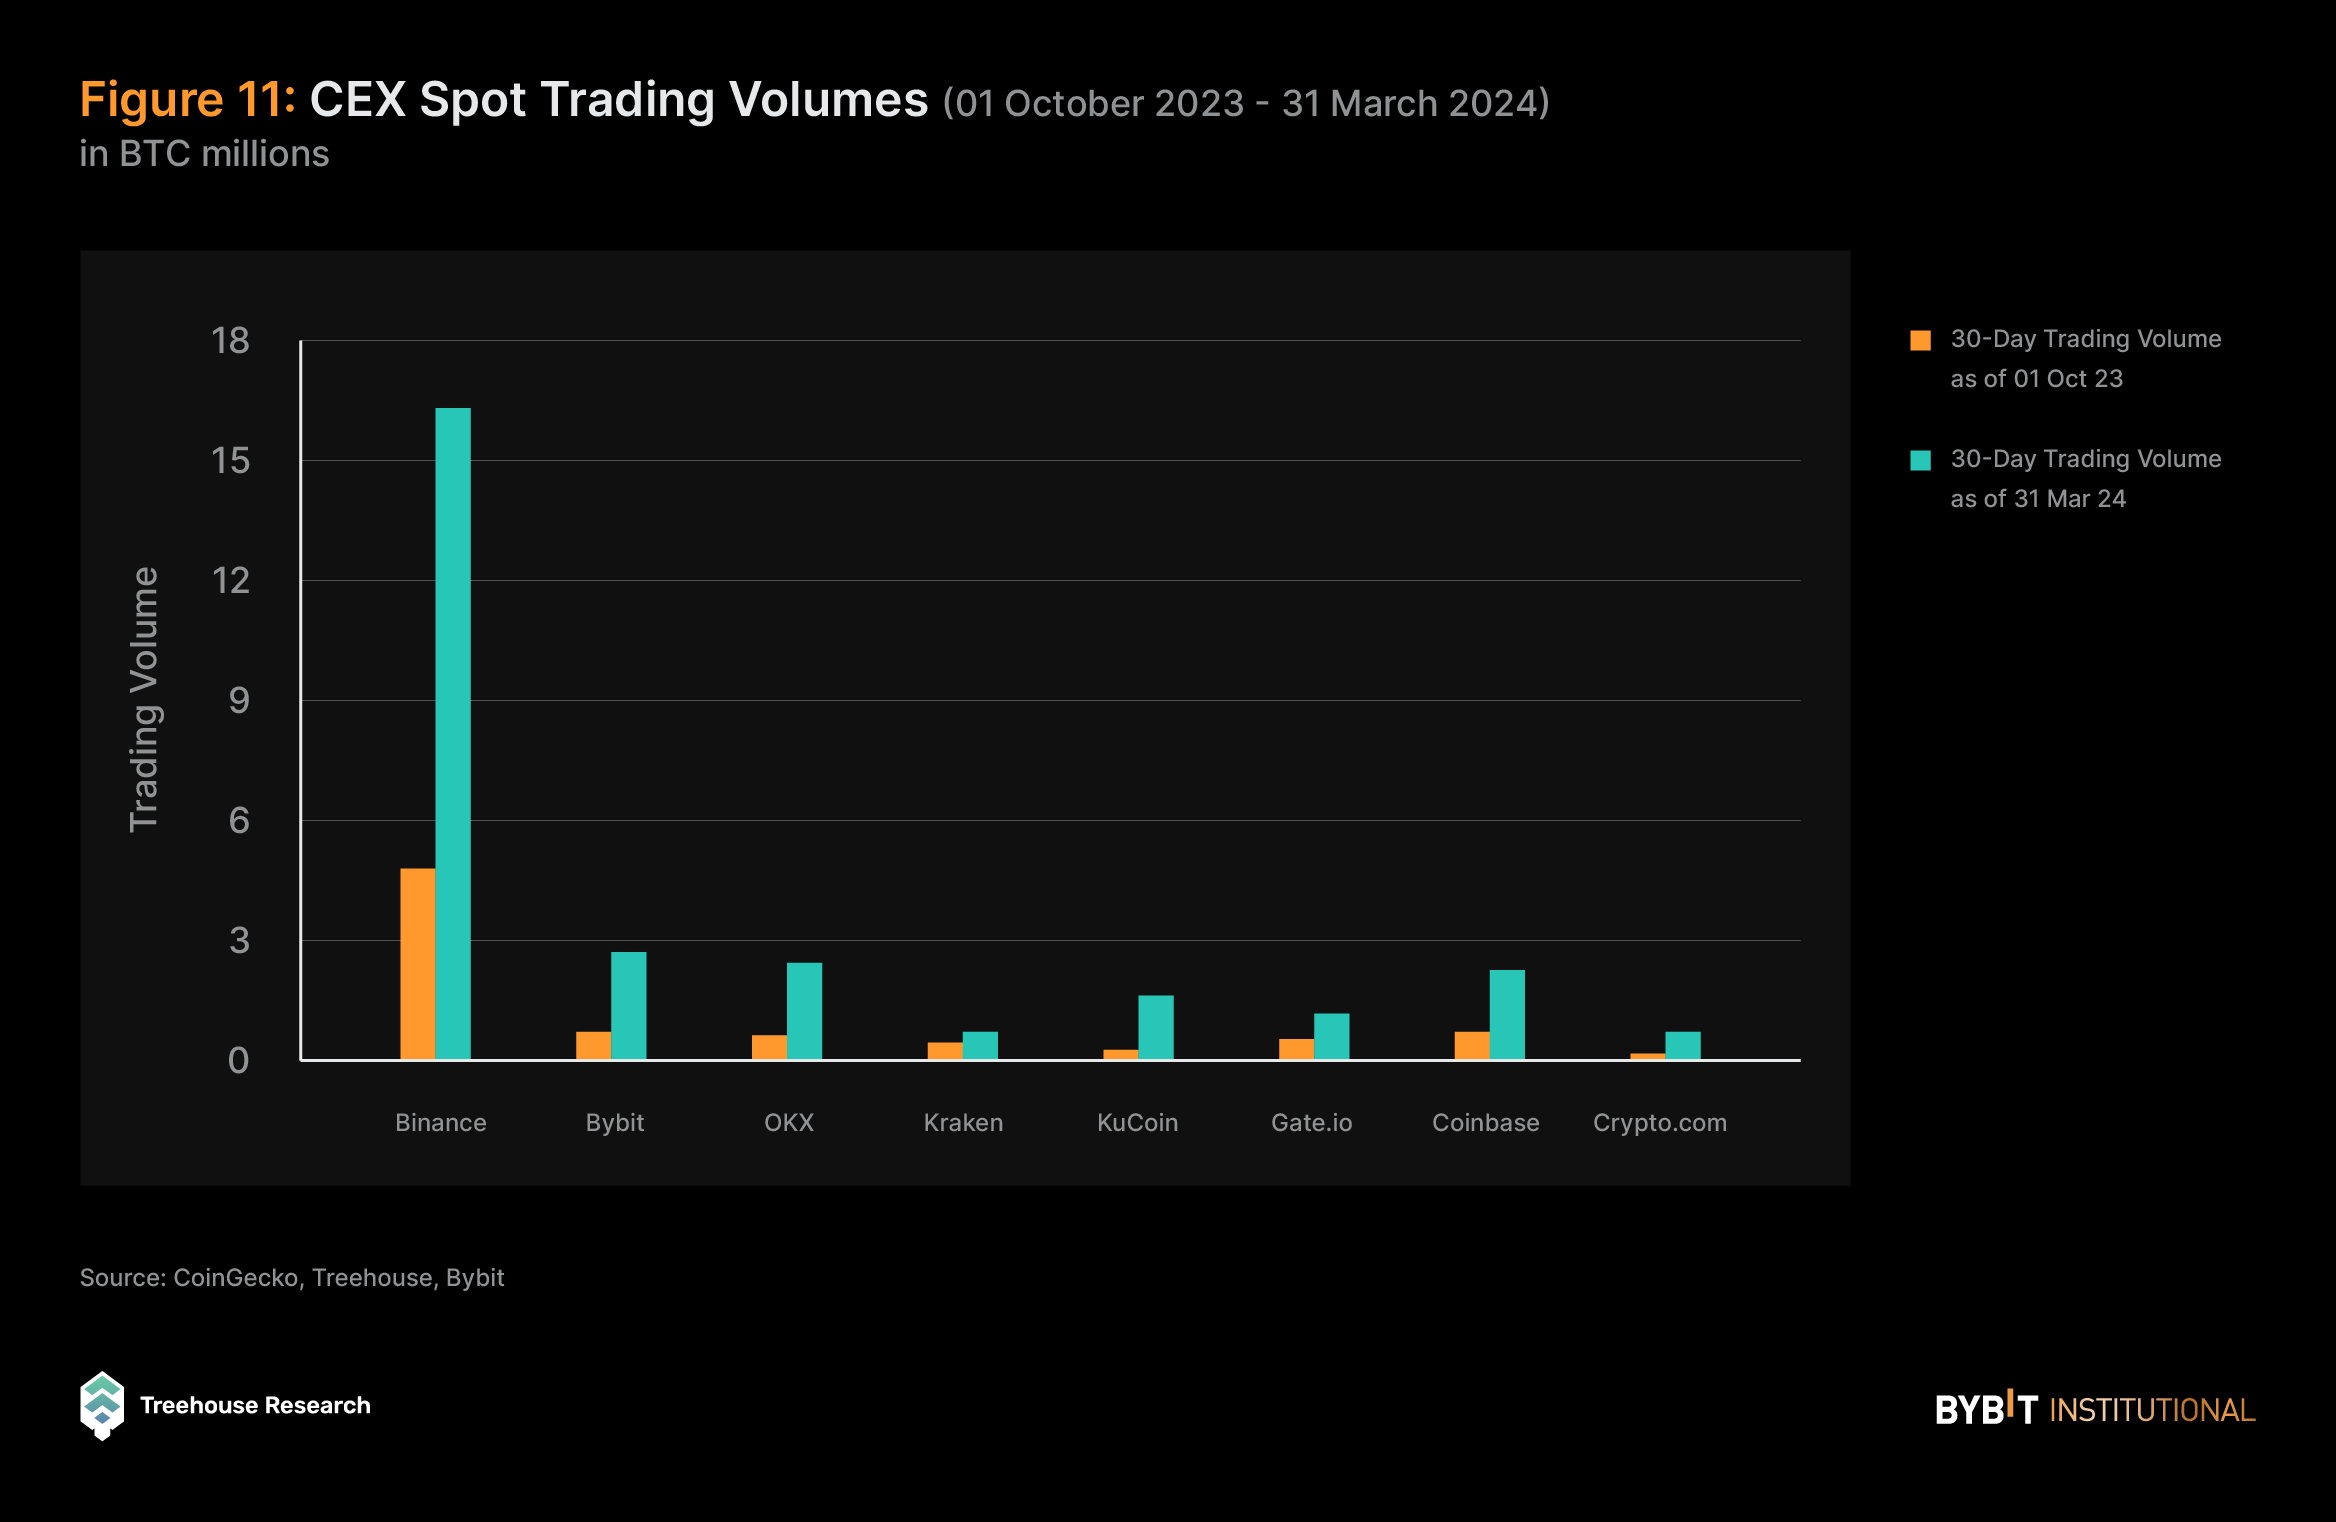
Looking at the 30D trading volume across various centralized exchanges (CEXs), Bybit’s volume had an impressive growth of over 264%, reflecting its competitive edge and robust market positioning. This figure also surpasses the industry’s average growth rate, solidifying Bybit’s leading position. In terms of other leading CEXs, OKX also saw substantial growth at 278%, while Binance followed with 239% growth with Coinbase trailing at 193%.
These growth trends were largely propelled by the significant price movements in BTC and ETH, along with the ETF approvals, which injected liquidity into the cryptocurrency market and attracted new participants to major centralized exchanges.
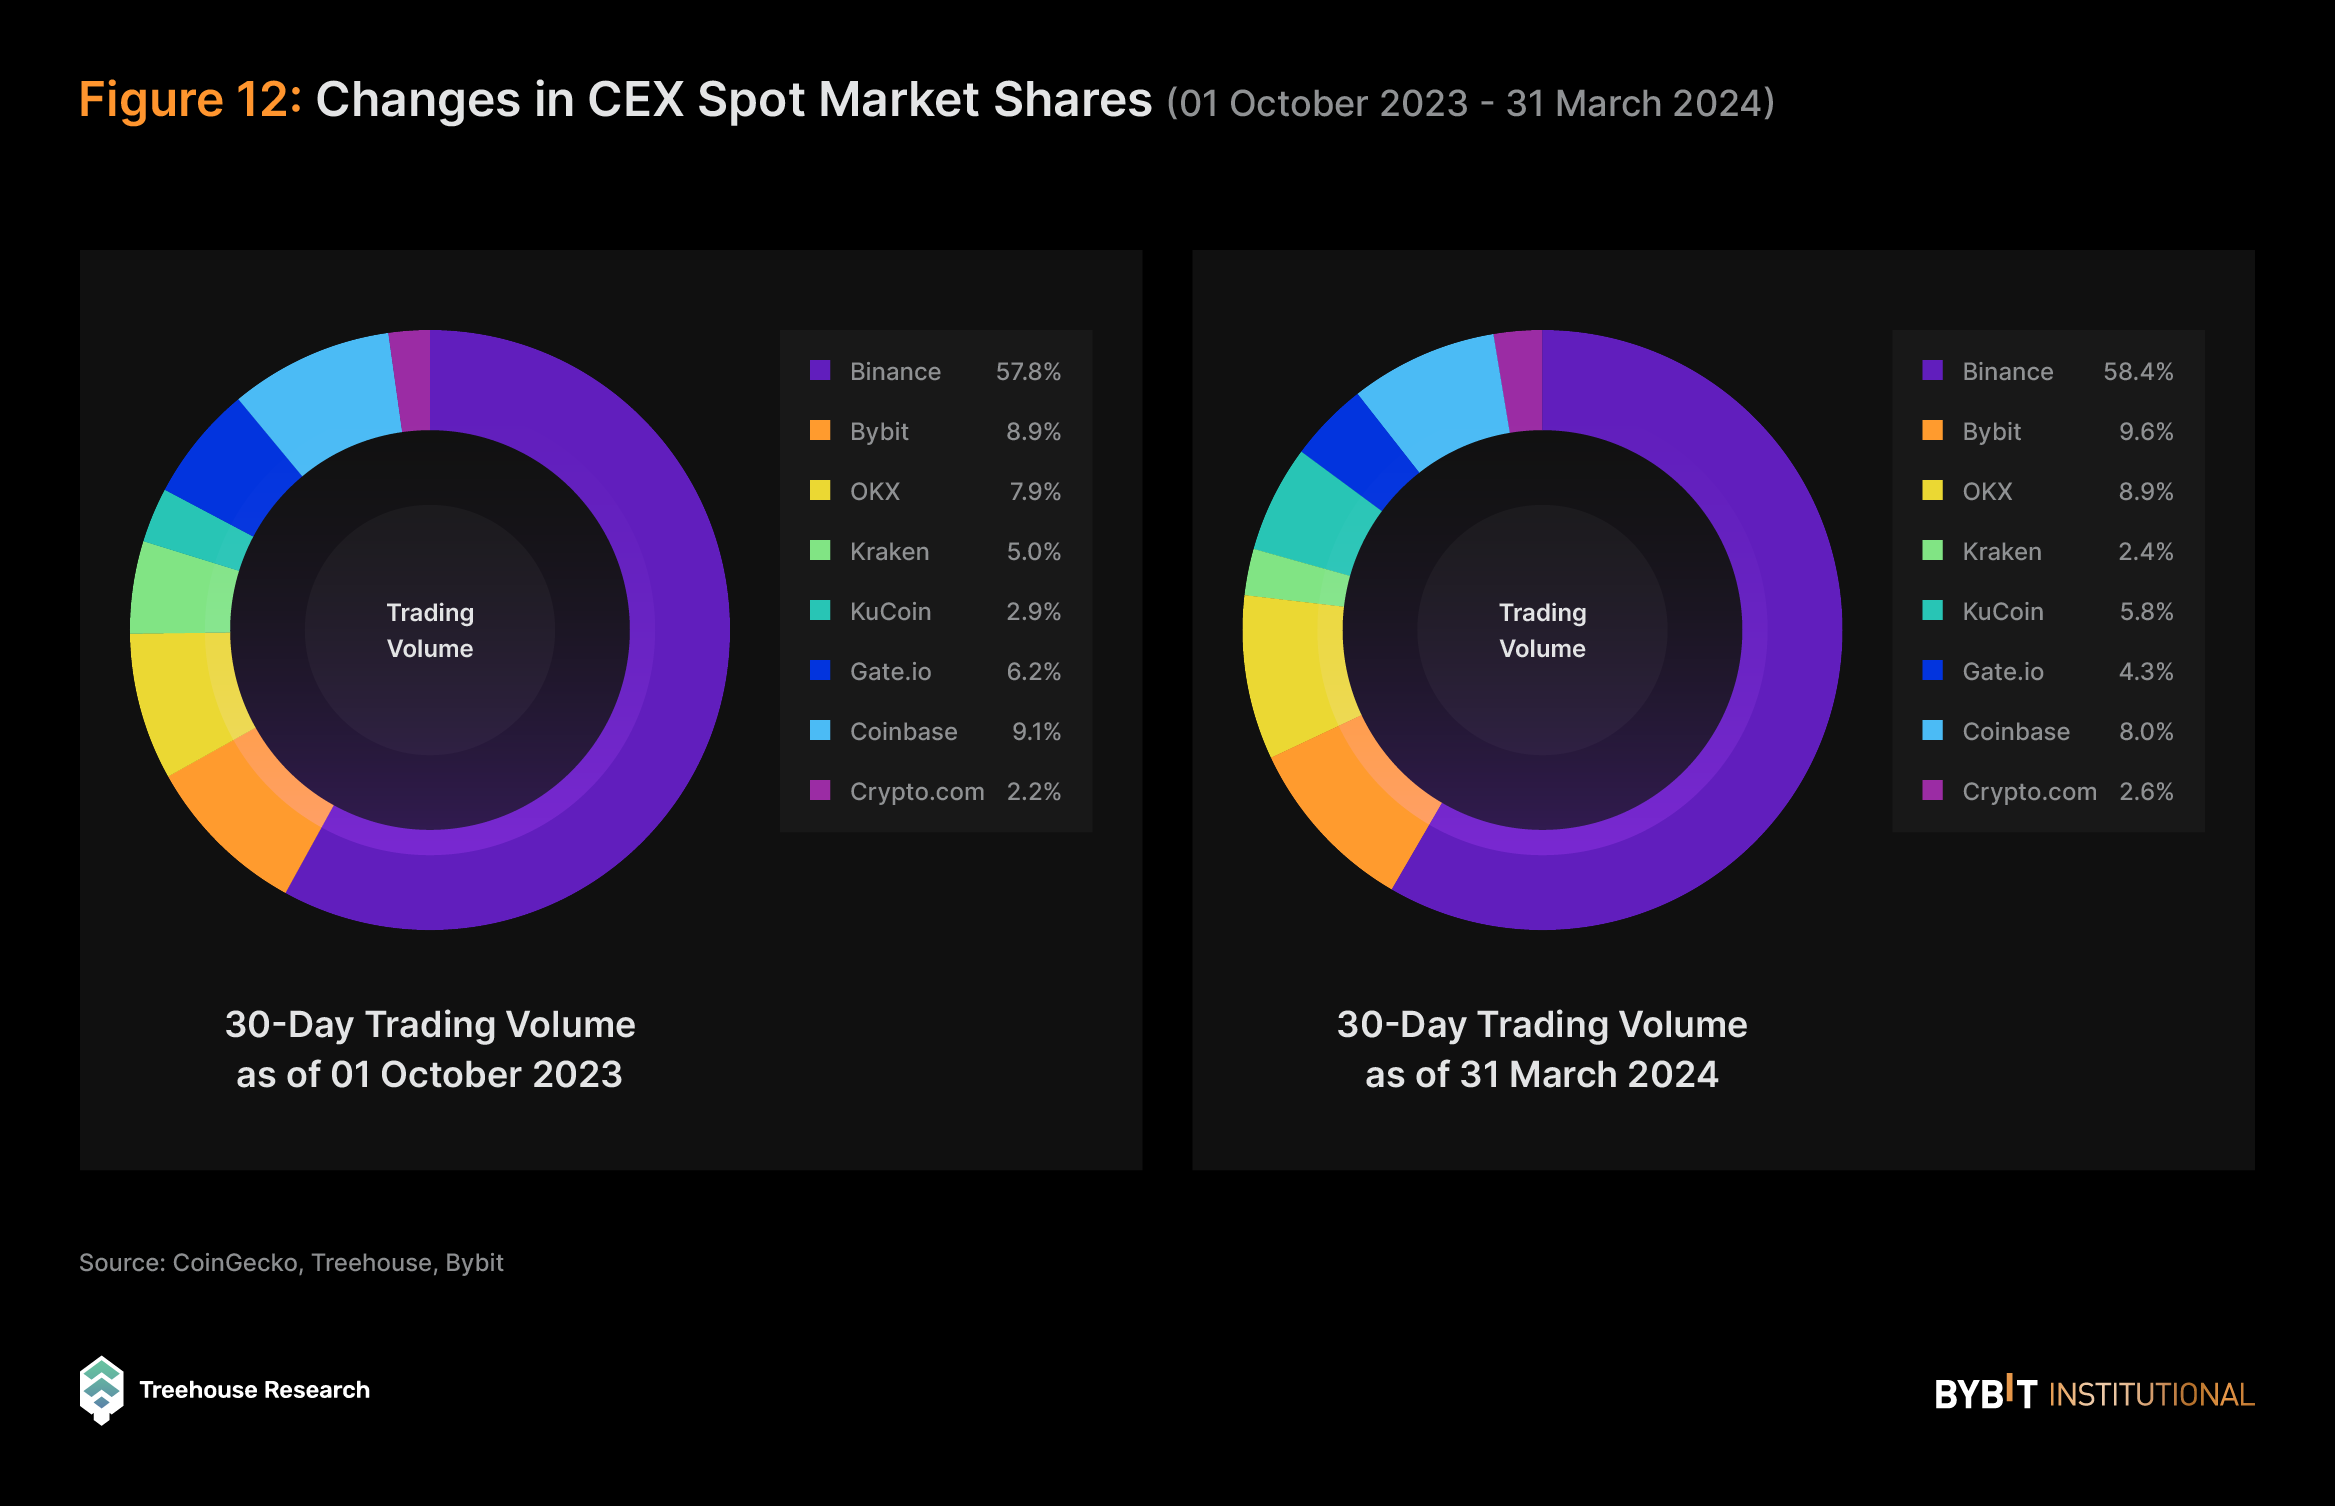
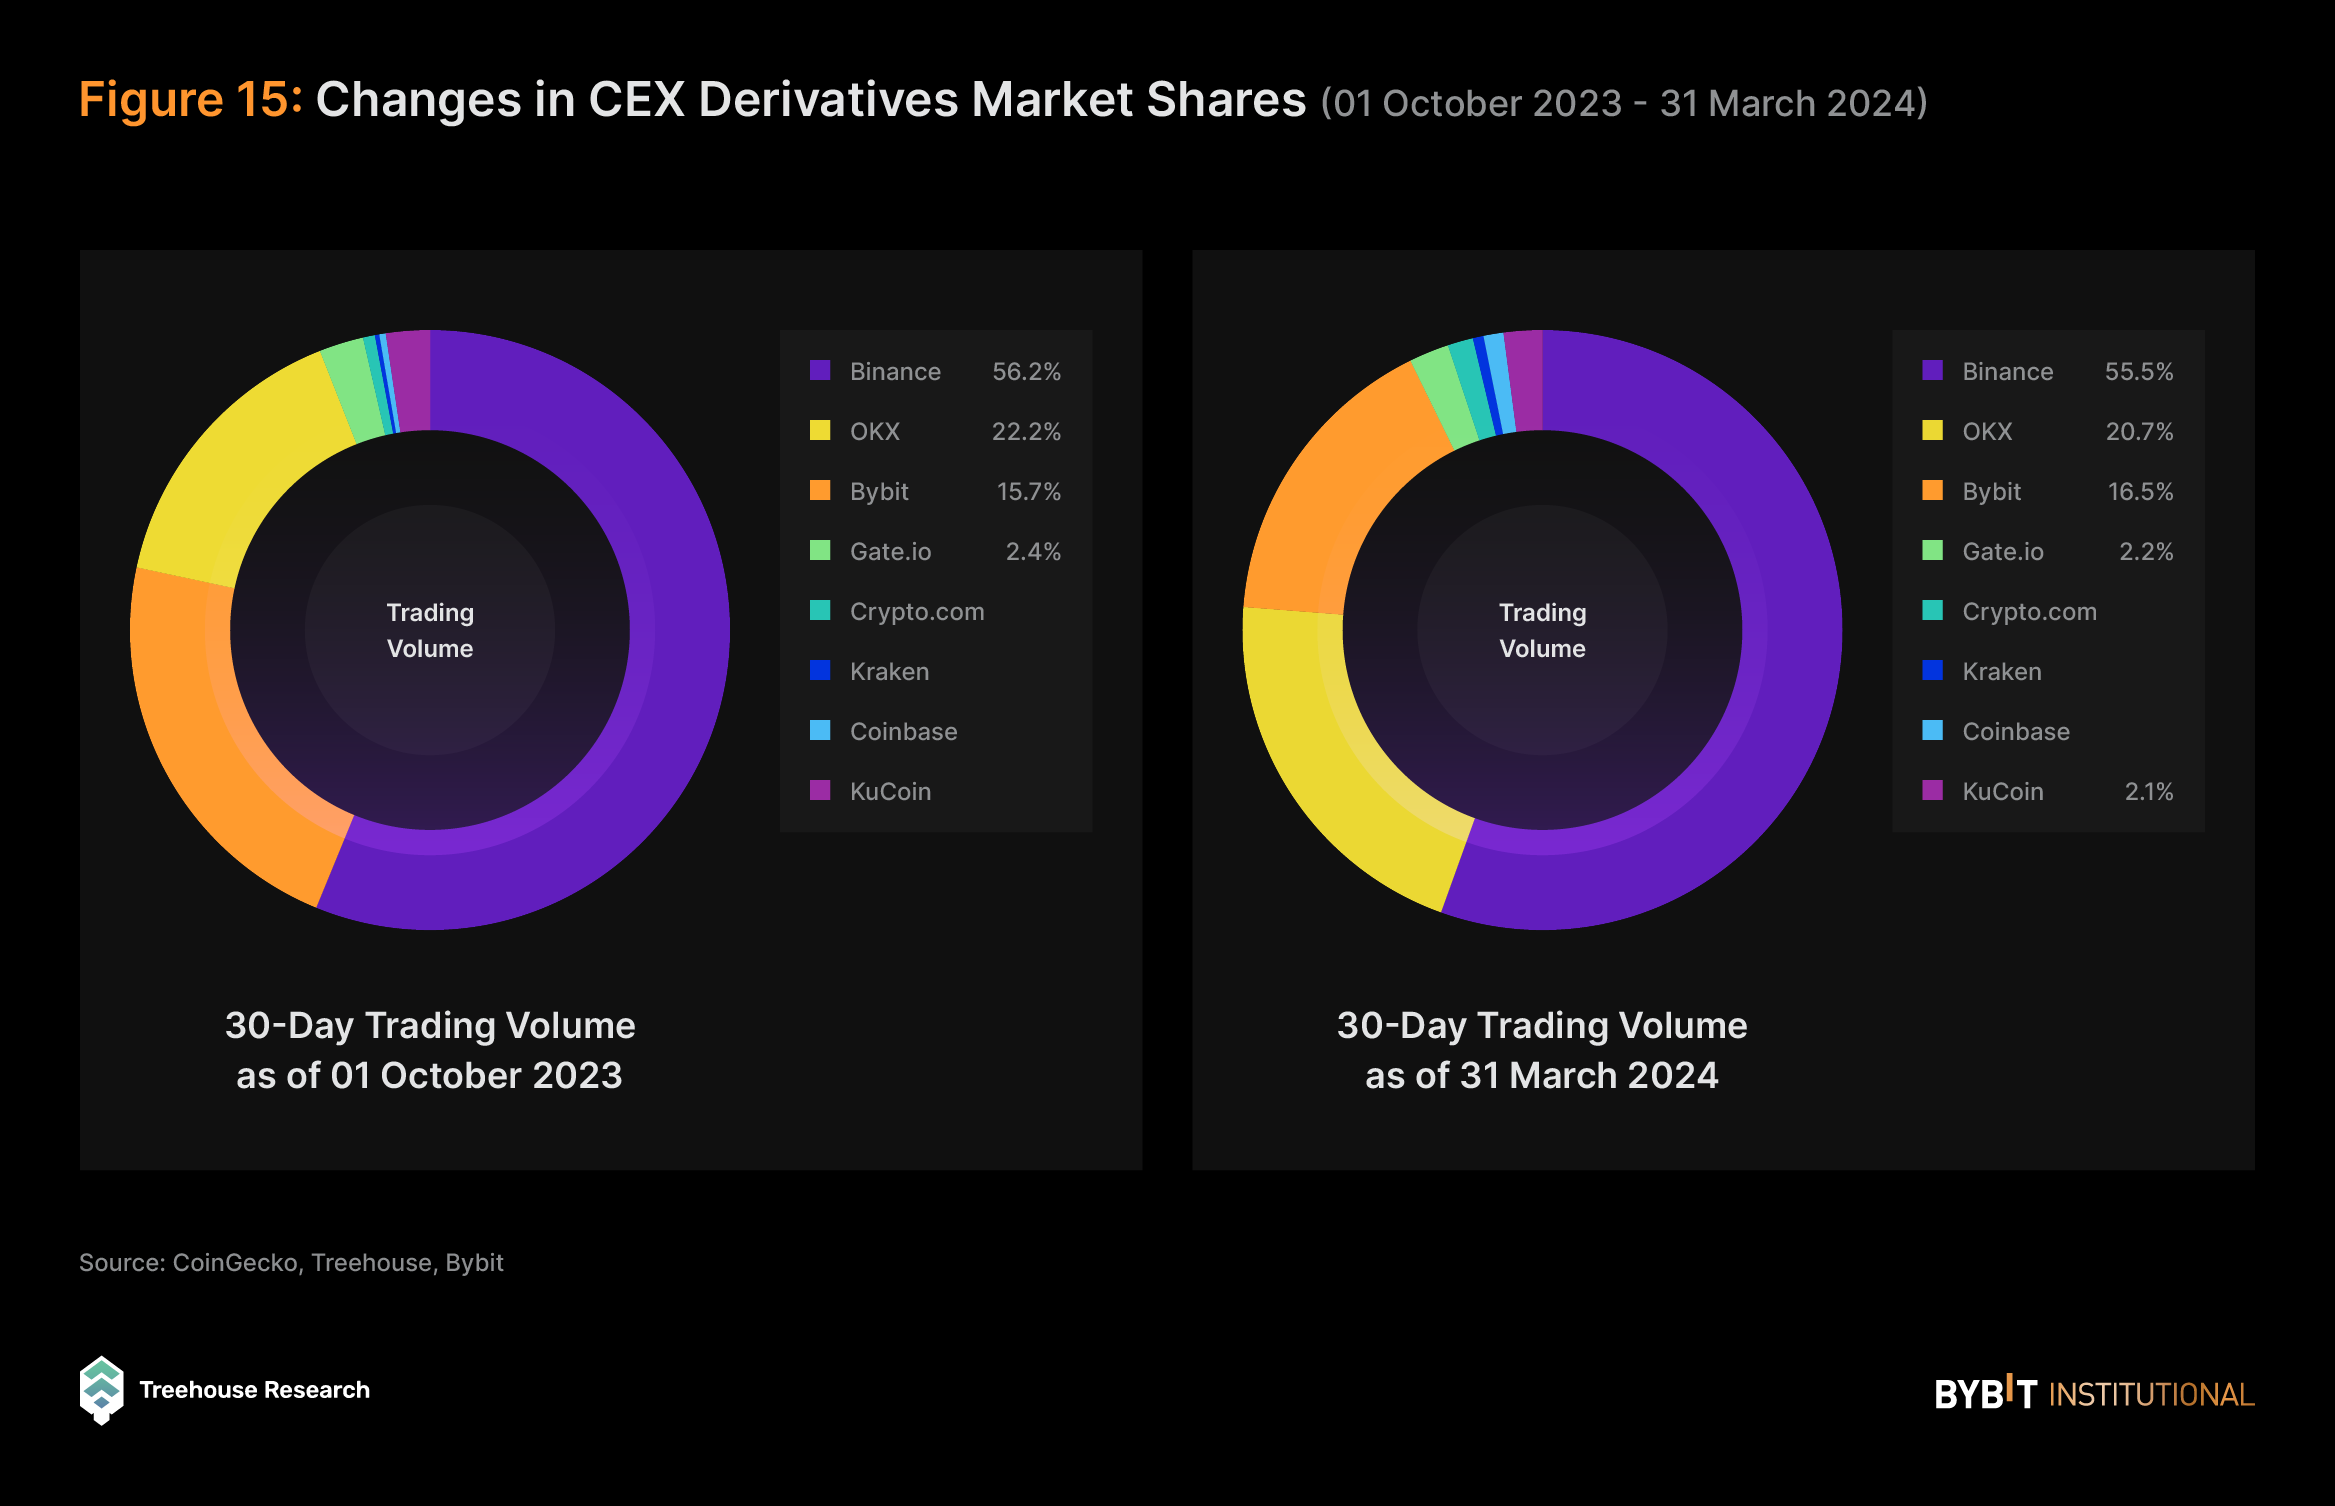
In terms of overall market share, while Binance continues to dominate the market with over 58% of the total spot trading volume, while Bybit attained a 7.8% increase to almost 10% of the total spot market.
One recent development was Binance’s settlement agreement in November 2023, requiring the exchange to pay a $4.3B fine for alleged financial breaches. This settlement, along with CEO Changpeng Zhao stepping down, marked a pivotal moment for Binance.
Bybit’s gains in market share can be interpreted as an indication of its strengthening foothold within the trading community, possibly owing to its robust platform features, user trust and adaptive business strategies, which resonate well with its user base. Moreover, this ascent in market share, particularly in the context of Binance’s slight decline, suggests a redistribution of trader preferences and liquidity.
This growth can be attributed to several catalysts, notably the introduction of Bybit’s Unified Trading Account (UTA). This innovative feature consolidates various trading products into a single account, which enables traders to utilize collateral without the need to sell assets, thereby maximizing capital efficiency.
Moreover, Bybit’s launch of a new institutional loan program likely contributed further to the growth in market share. This program offers institutional traders competitive loan-to-value (LTV) ratios, allowing them to leverage their collateral assets for margin trading across both spot and derivatives markets at favorable rates.
Bybit has also rolled out an incentivized campaign, providing interest-free loans to institutional traders who meet specific criteria, thereby encouraging increased participation in the platform.
Spot DEXs
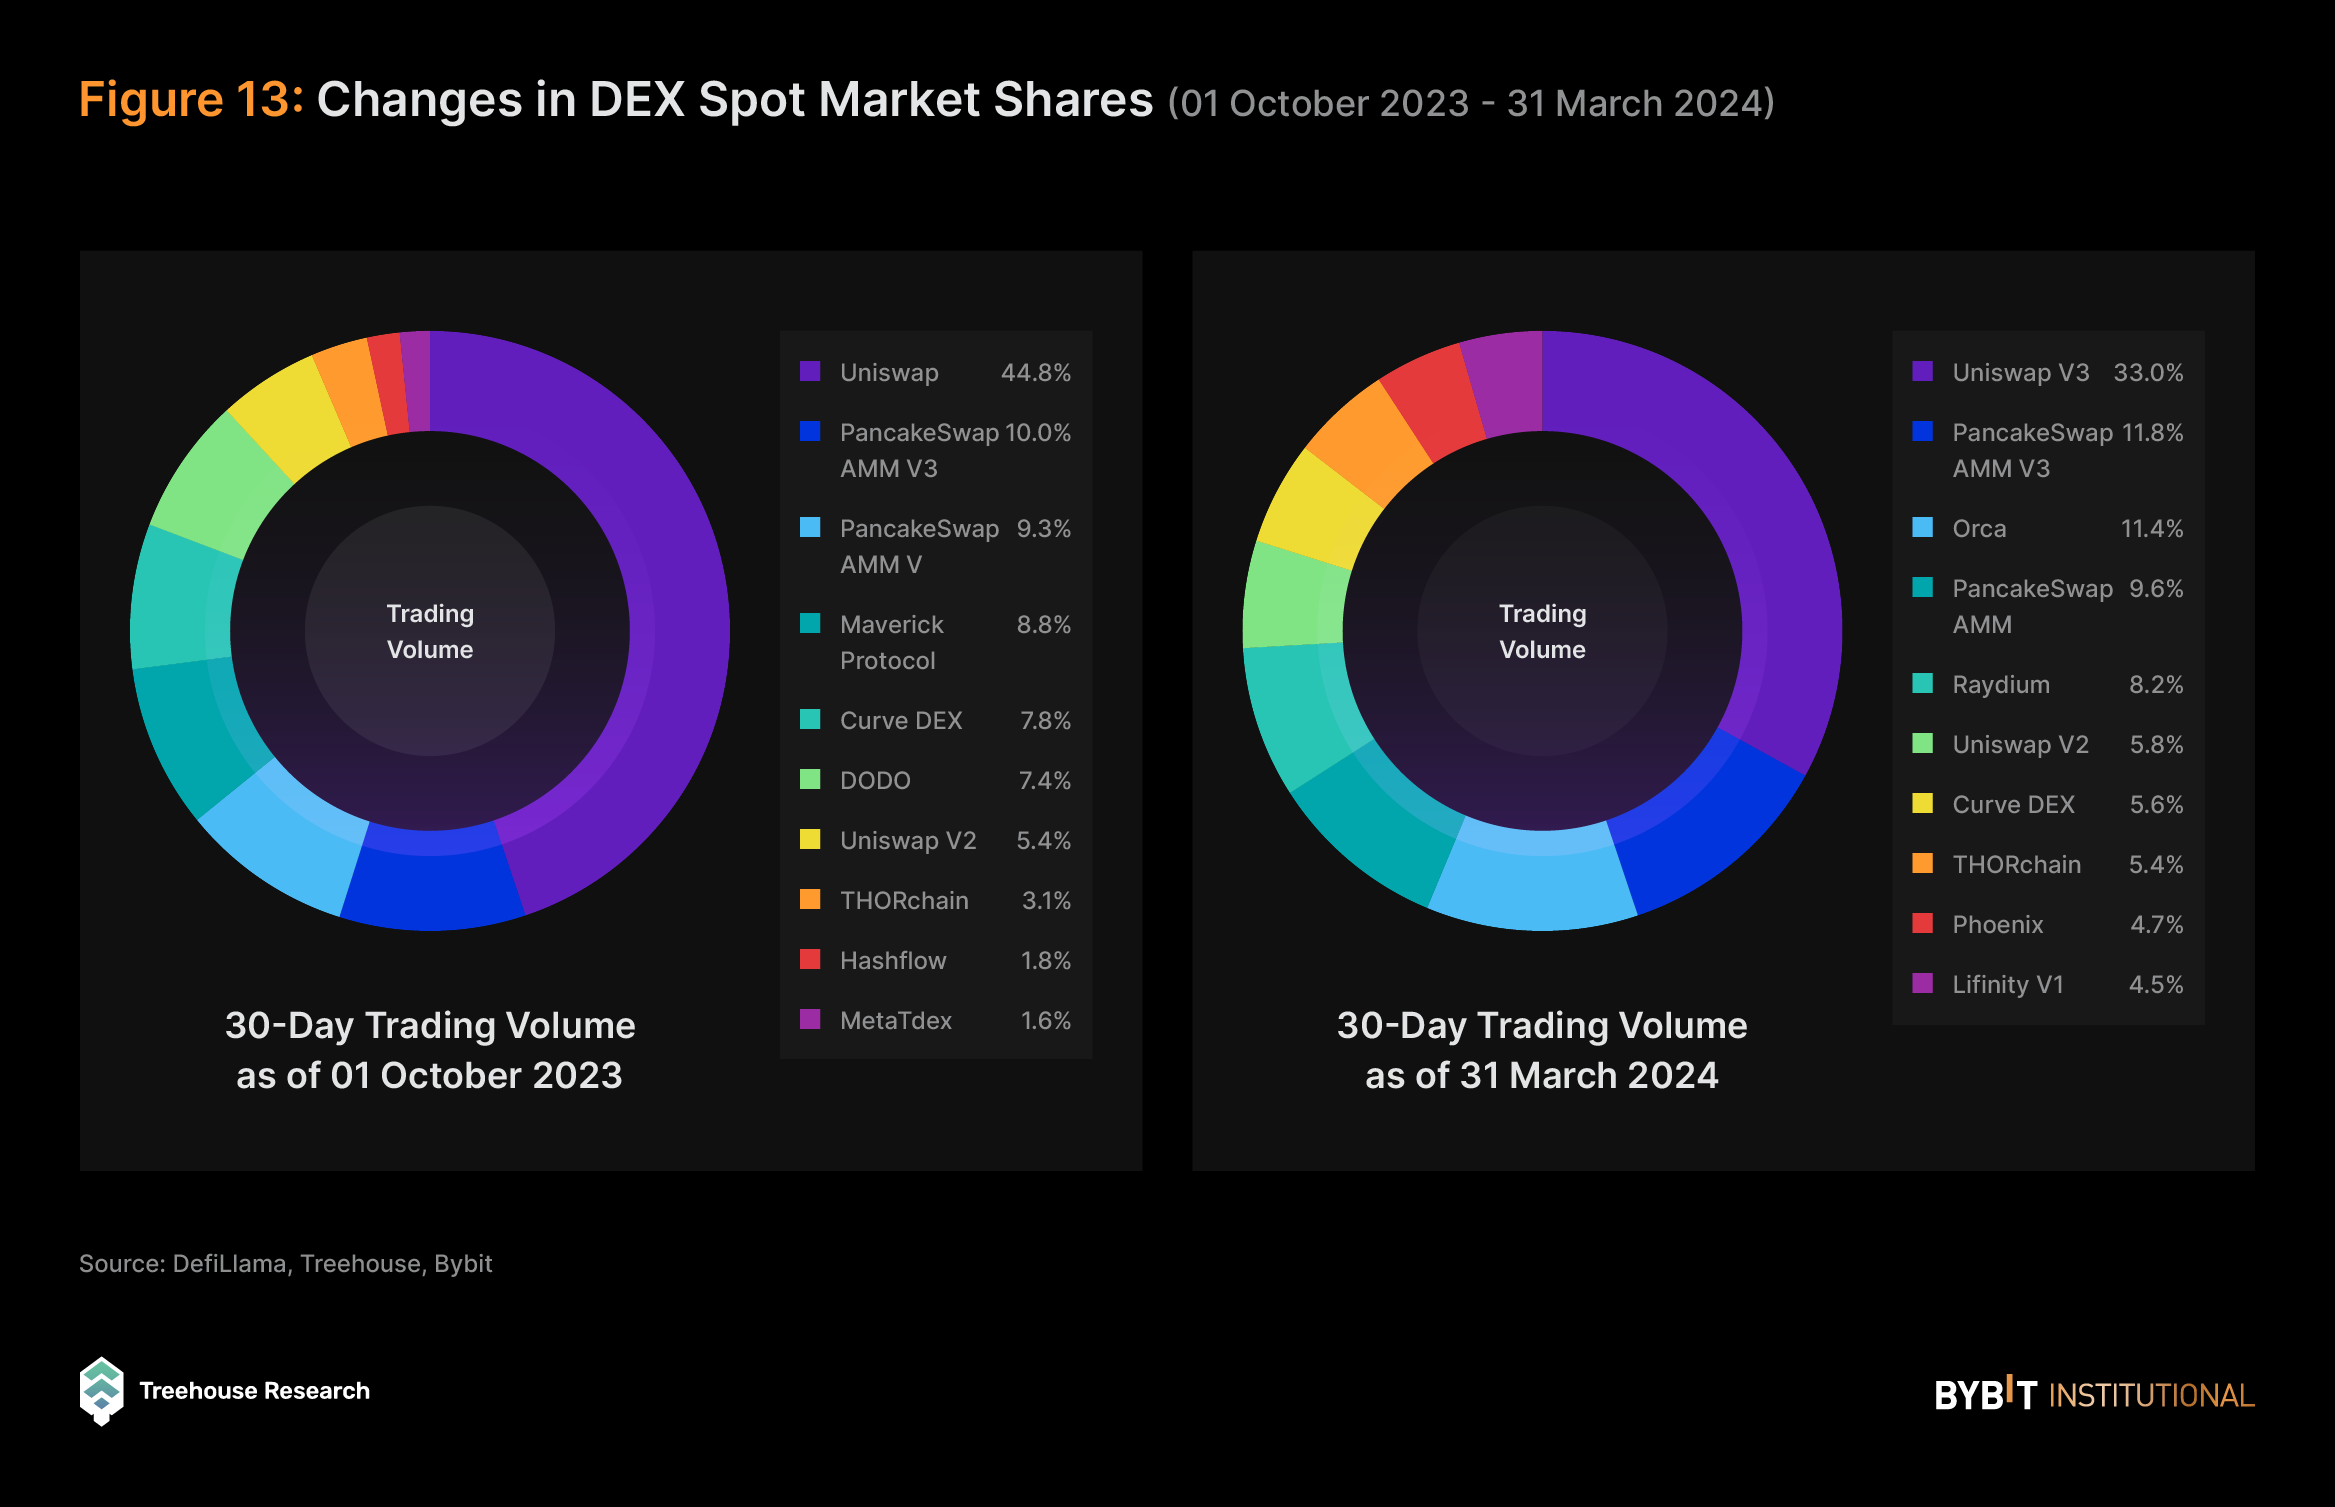
In terms of decentralized exchanges (DEXs), Uniswap V3 continues to dominate in the space, commanding 48.9% of the market share in October 2023 but decreasing to 33.0% in February 2024.
Despite this decline in market share, Uniswap V3 saw its total volume increase by over 320%, from $17.19B in October 2023 to $65.50B in March 2024.
PancakeSwap V3 is in second place, with a market share of 10.0% in October 2023, increasing slightly to 11.8% in March 2024. It recorded a significant 580% increase in trading volume from $3.43B in October 2023 to $23.49B in March 2024.
With the recent interest and traction gained in Memecoins over the past month, there has been a substantial increase in trading volume on Solana. This has placed Orca and Raydium among the top players with 11.4% and 8.2% of the market share respectively.
This increase in trading volume among DEXs could derive from several factors, such as Bitcoin ETF approvals, BTC reaching an all-time high, token standard innovations in the cryptocurrency space, as well as Memecoin Season, which formed the impetus for traders and investors to trade liquidity in the cryptocurrency space.
Derivatives CEXs
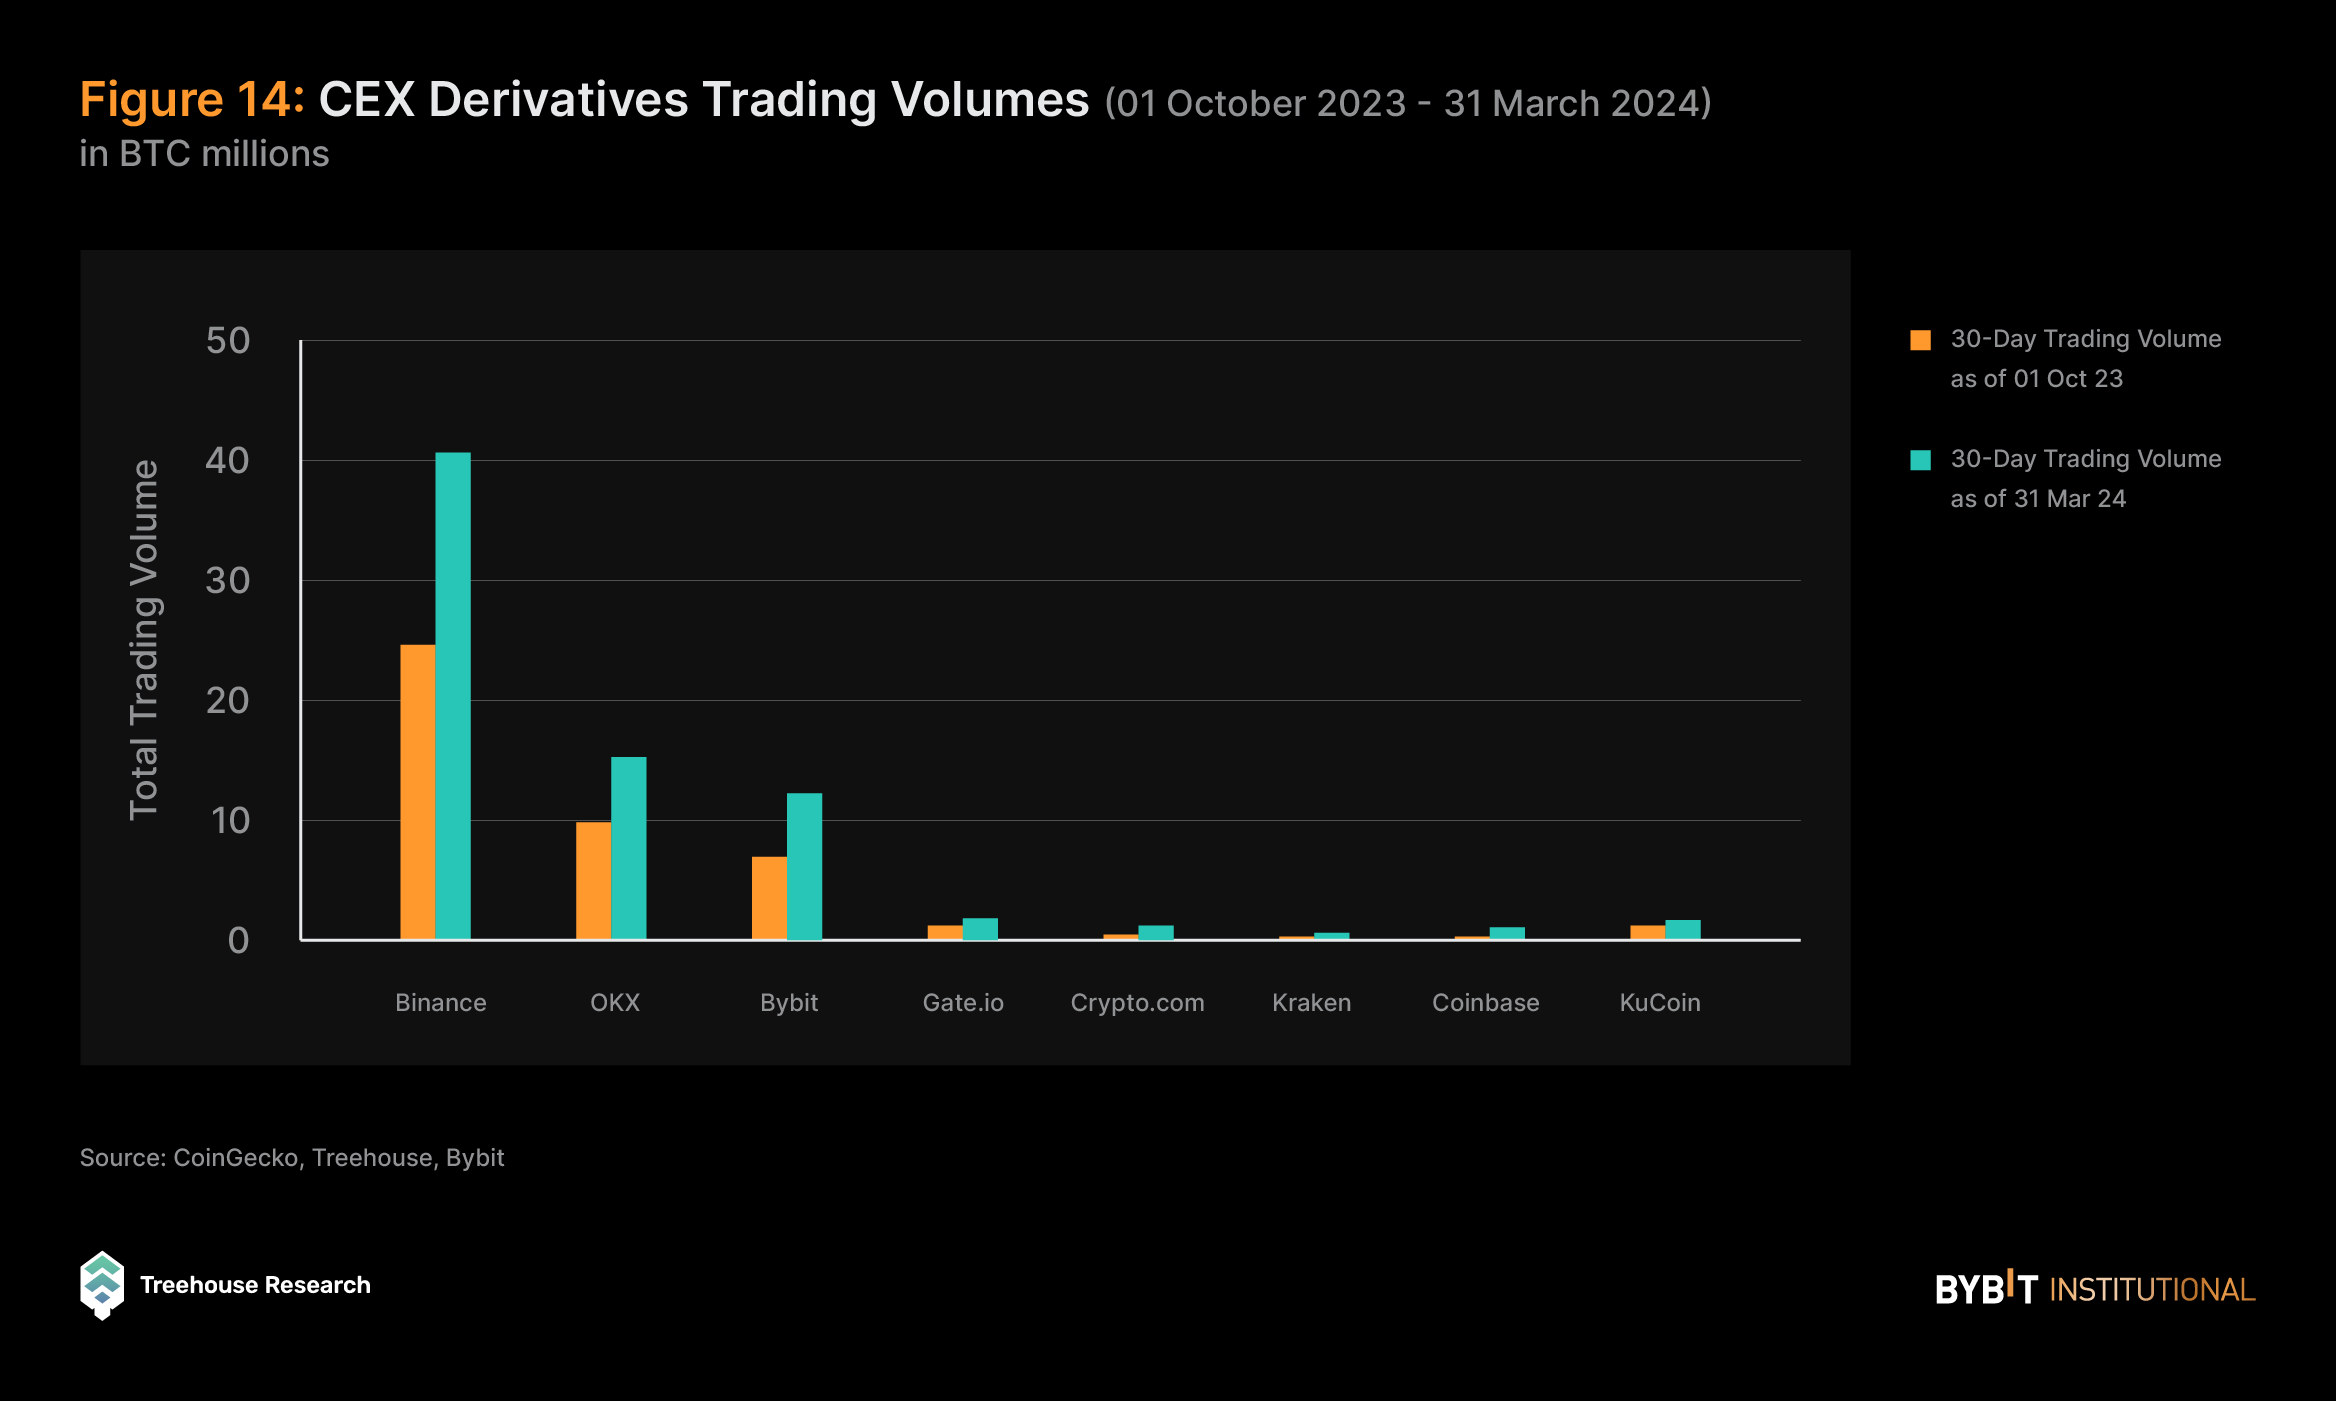
In terms of the derivatives market on CEXs, the market has witnessed an increase in 30D trading volume as depicted in the above figure. As the data illustrates, the derivatives market for CEXs is almost entirely dominated by Binance, OKX, and Bybit.
Binance, the leader in this market, has seen an increase in its 30D trading volume with growth of approximately 66.08%. OKX, as the runner-up, has experienced a slight growth in its trading volume instead, with an increase of 57.34%.
Bybit, on the other hand, has shown the highest growth out of the three leading CEXs. Within the observed period, Bybit has had a notable surge of 77.33% in trading volume, significantly outperforming the average market growth and indicating Bybit’s strengthening presence in the derivatives space. This indicates that Bybit may be capturing market share from competitors in the derivatives trading space. Its strategic maneuvers, including enhanced platform features, competitive fee structures, and funding rates, are likely factors in attracting a higher volume of trading activity.
Derivatives DEXs
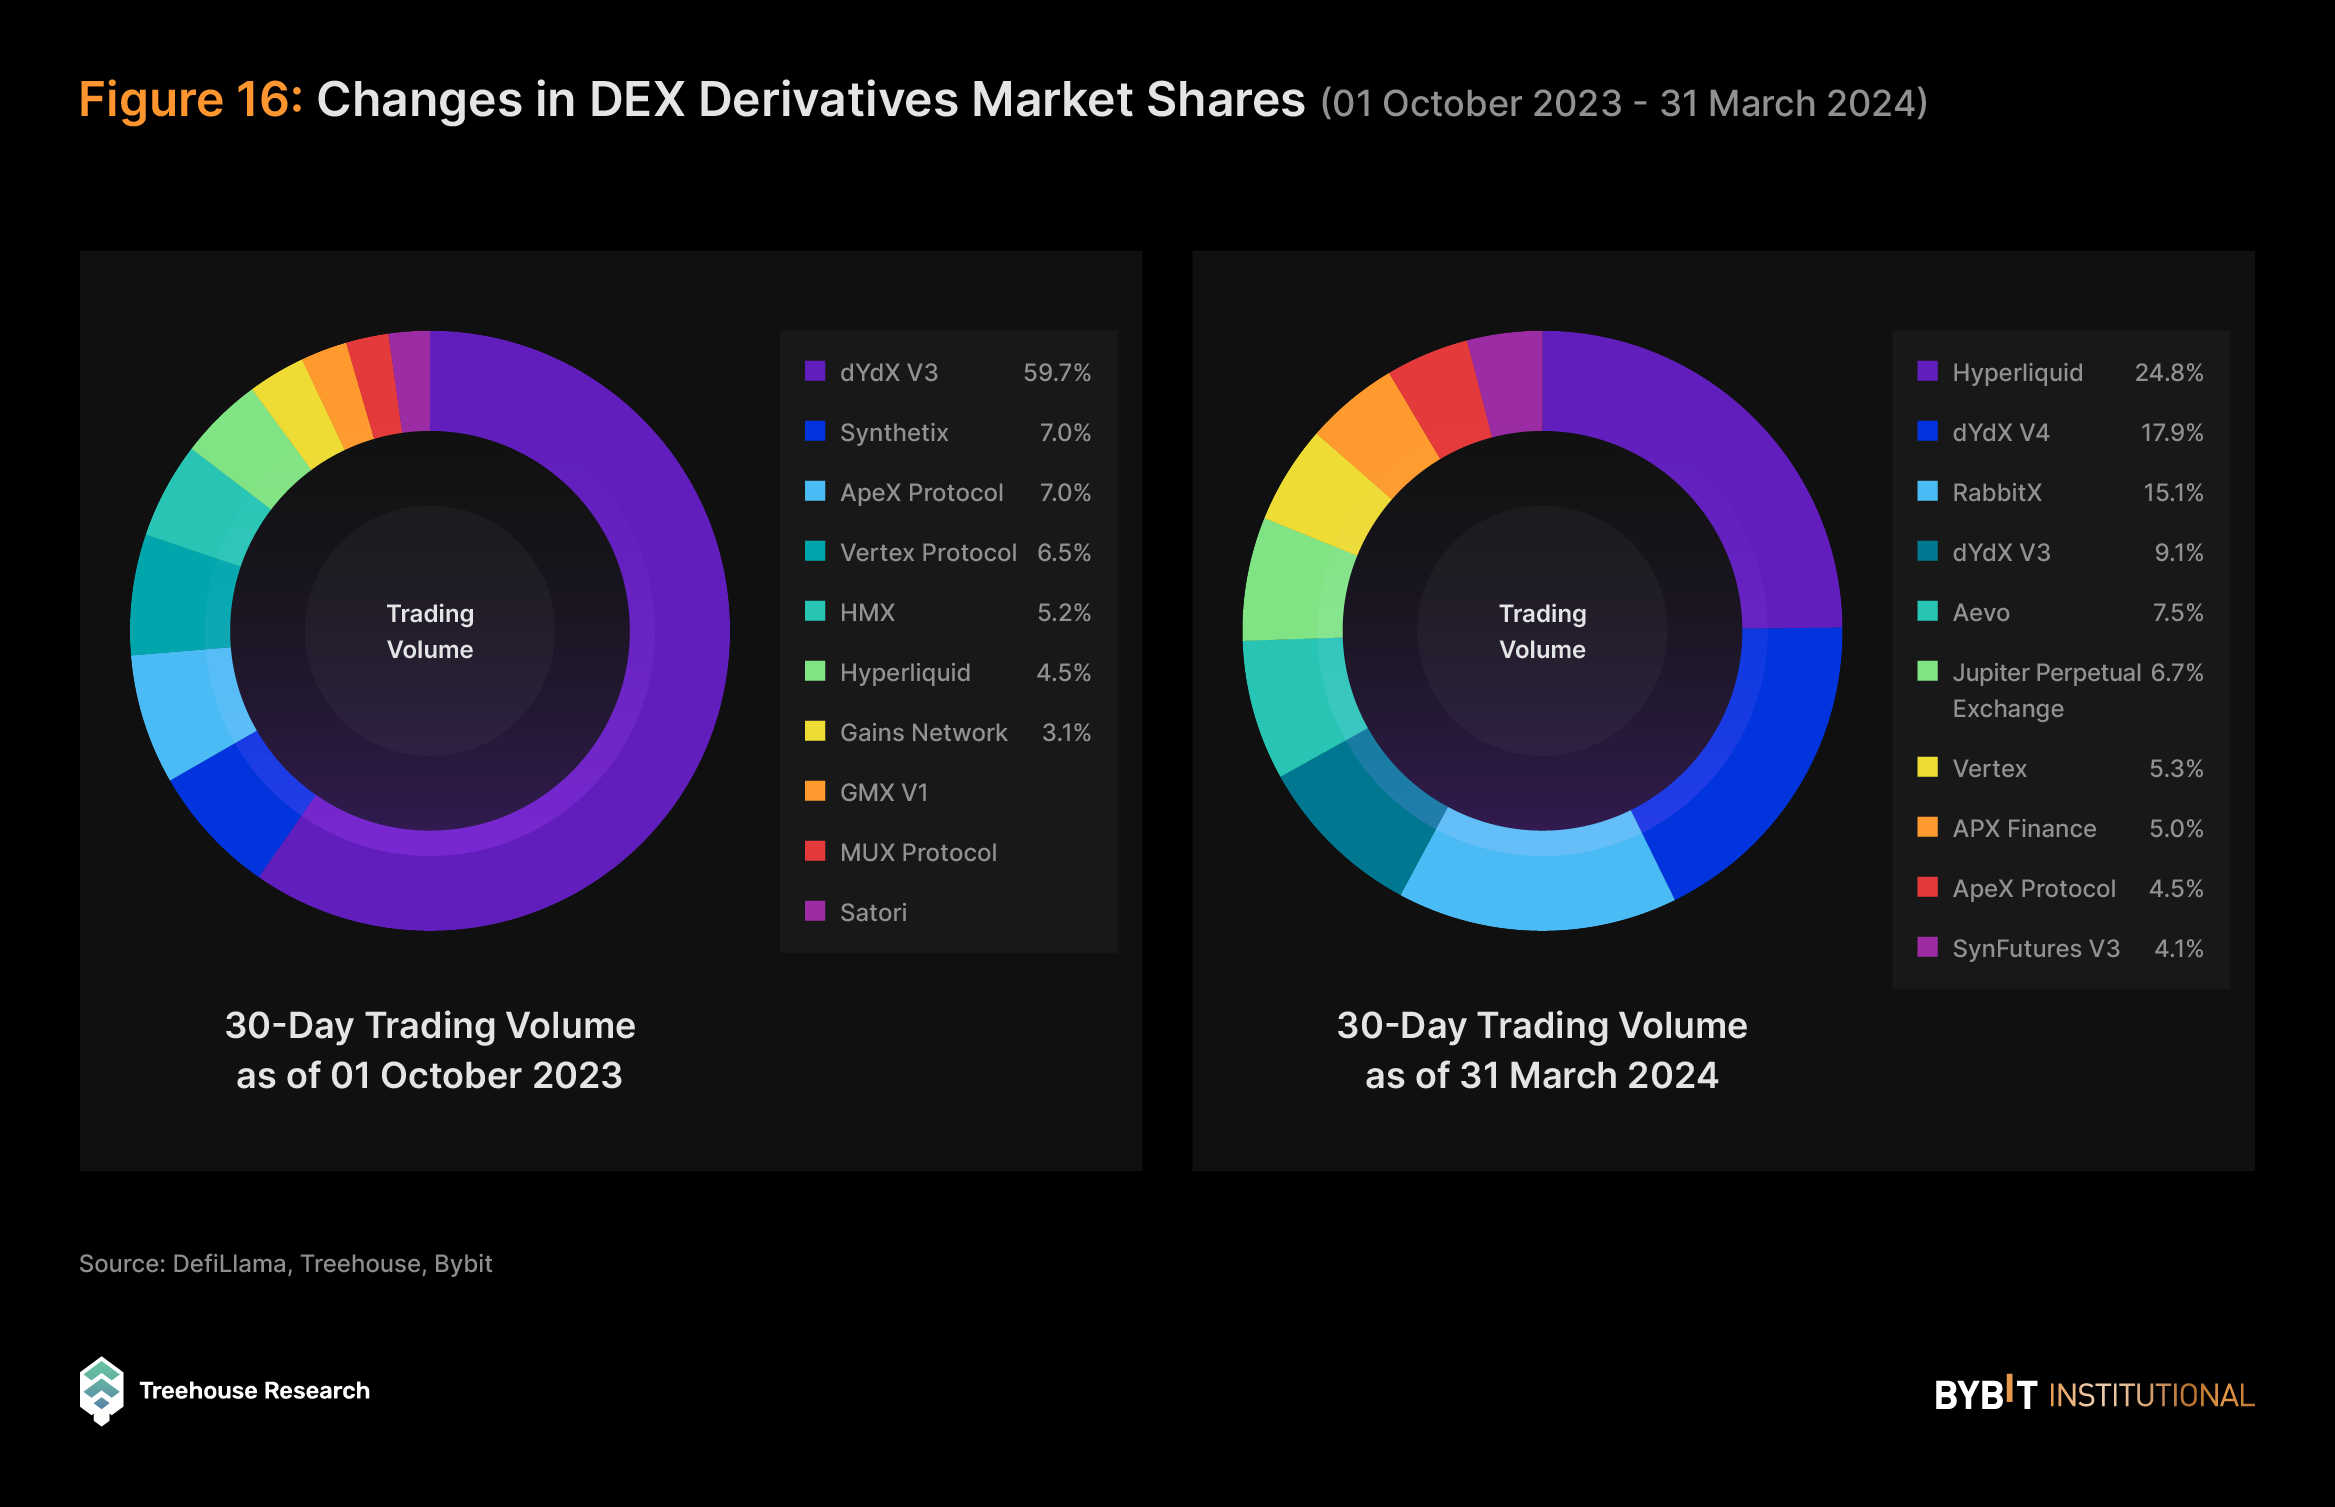
In the same period, several new players have emerged in the derivatives DEXs scene. Hyperliquid, for example, has likely garnered attention and trading volume that’s at least partly due to its airdrop points system, and the strategy of actively listing additional trading pairs. Airdrops are a common strategy that we’ve seen deployed in the recent quarter to attract user volume. This applies to Jupiter (JUP) as well, which had the largest airdrop on Solana in the past few months.
Consequently, the leading derivative DEX dYdX has seen its market dominance drop from 60% to 27% combined with its V3 and V4.
Hyperliquid, on the other hand, has experienced over 39x increase in 30D trading volume from $1.32B to $53.47B, and a growth in market share from 4.5% to 24.8%, the largest in the space.
Overall, the entire derivatives dex market has grown by sevenfold, with a total 30D trading volume amongst the Top 10 increasing from 29.4 billion to 215.3 billion.
Blue Chip Assets Current Landscape
BTC Performance: Pre- and Post-ETF Approval
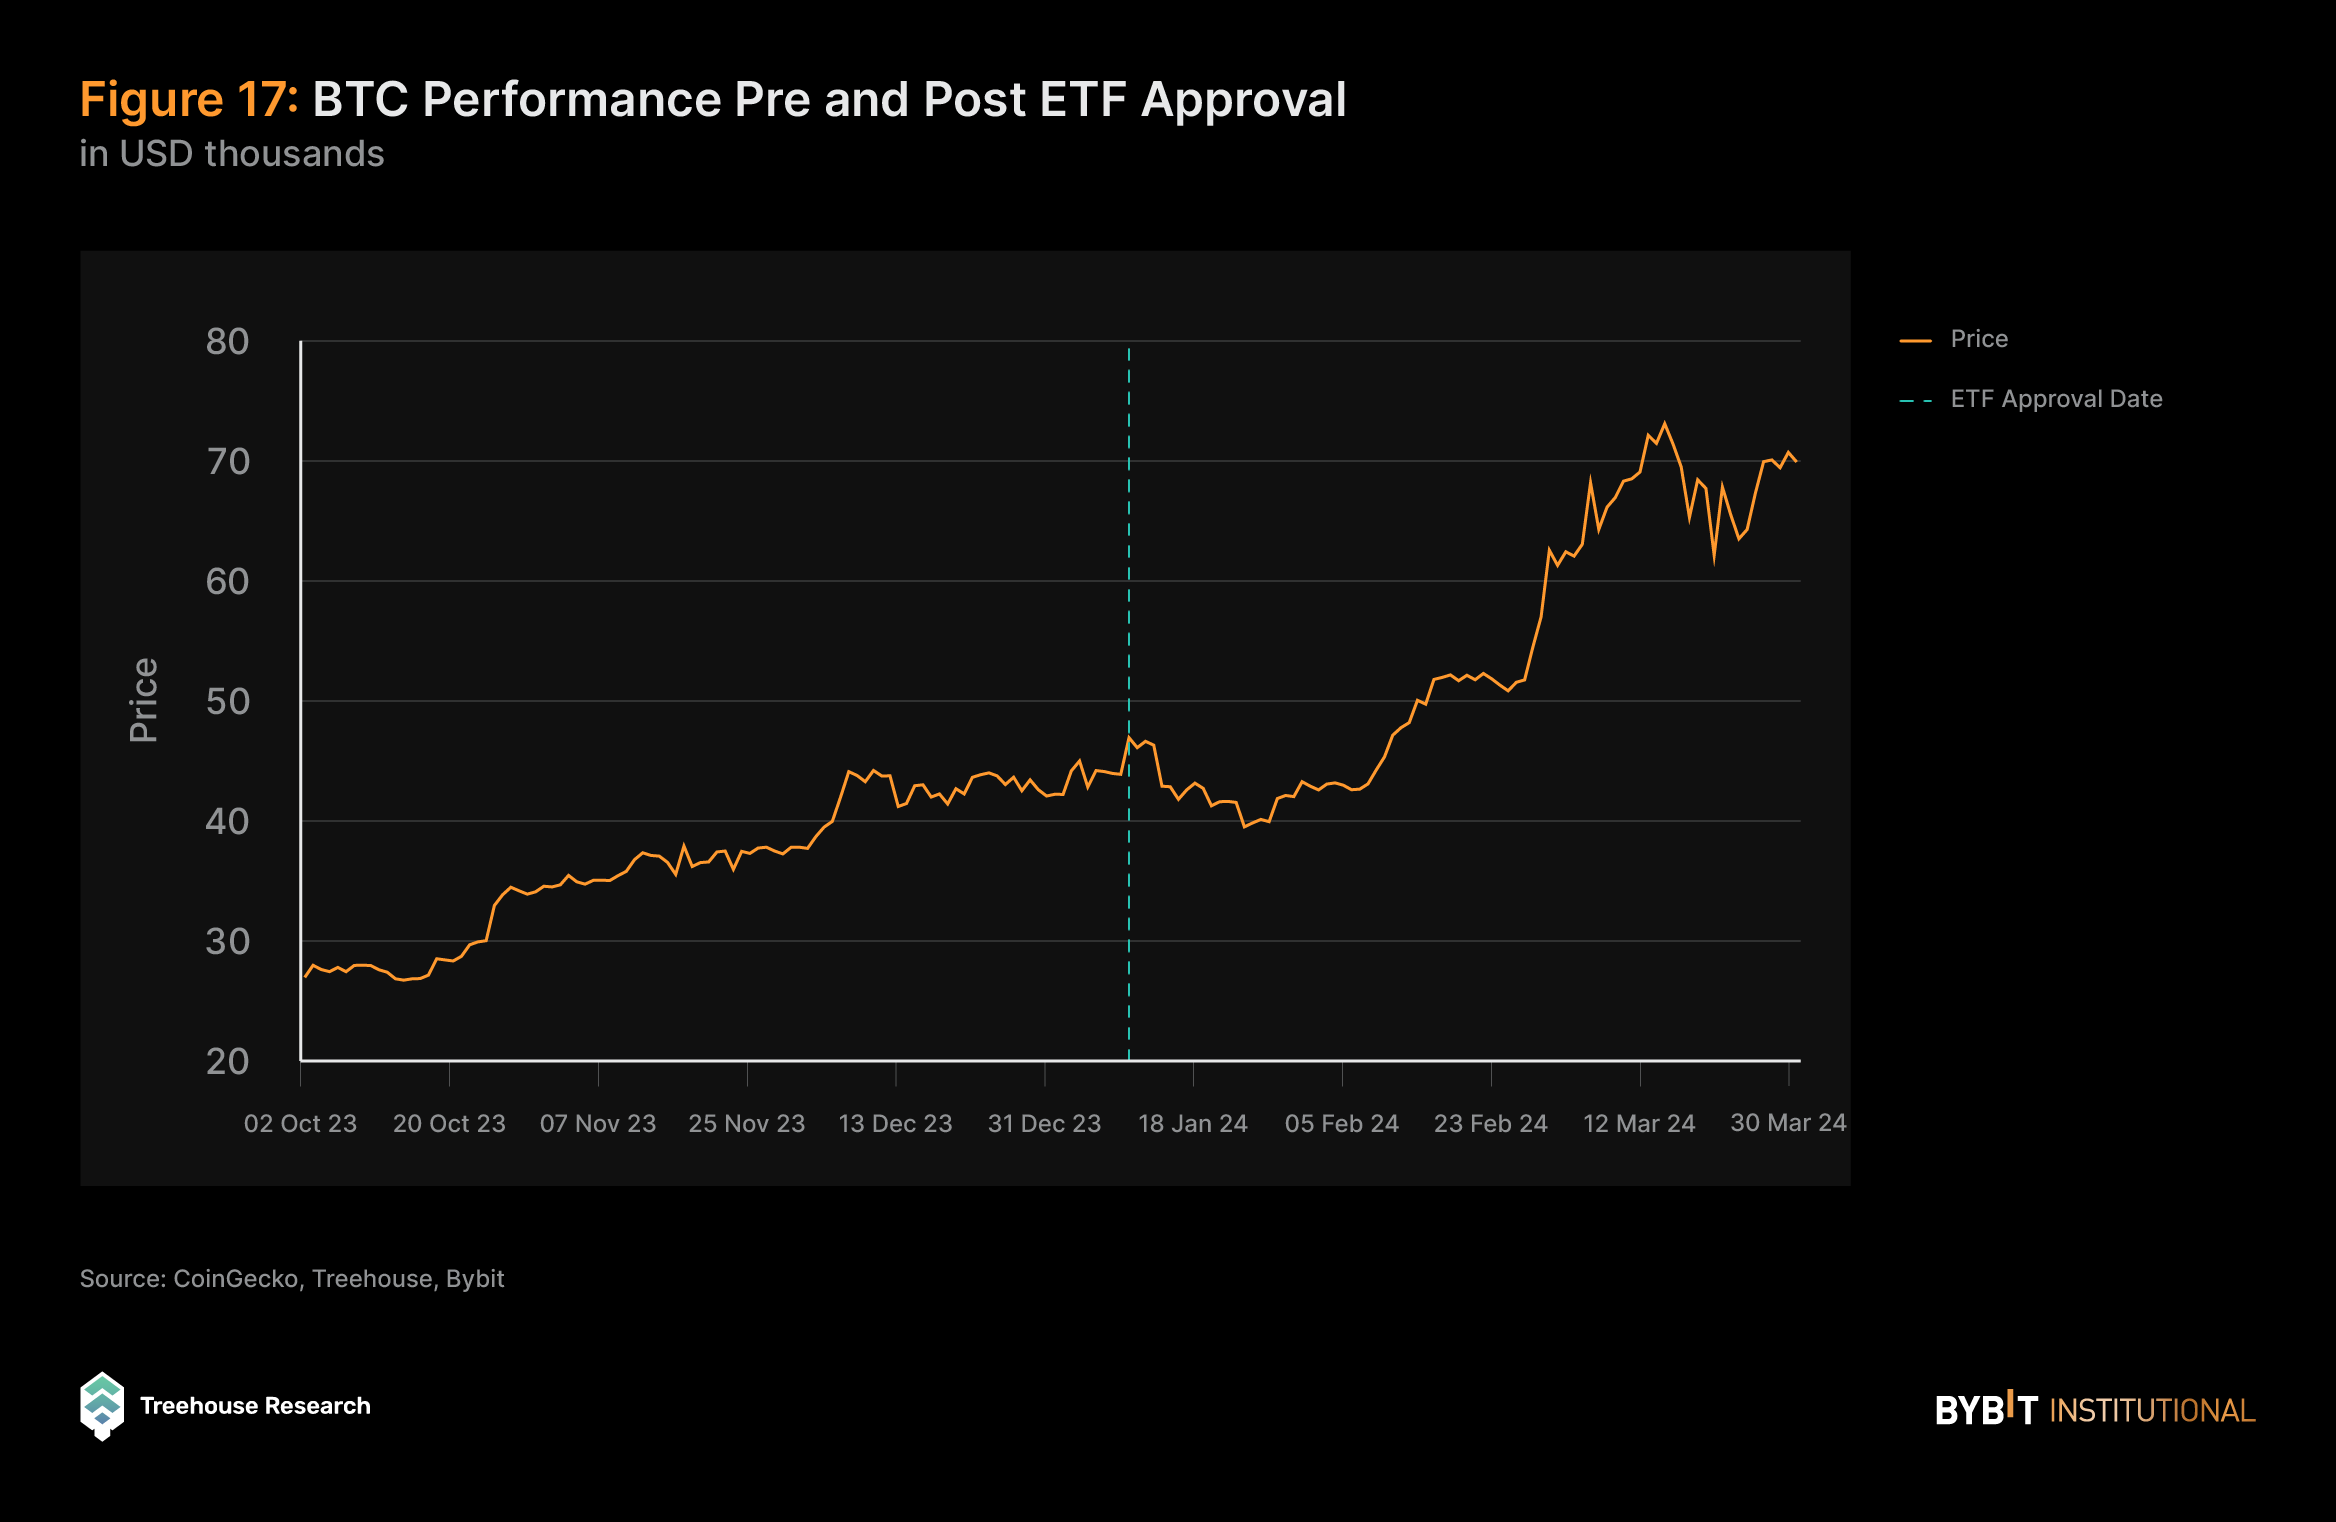
The narrative surrounding the approval of BTC ETFs played a significant role in shaping the trajectory of Bitcoin’s price over the past quarter. Leading up to the approval, there was a noticeable surge in BTC’s value as investor sentiment reflected optimism about the anticipated increase in demand and consequent appreciation in value that ETF approval was expected to bring.
However, following the approval, Bitcoin’s valuation experienced a swift downturn as the market reacted to the substantial selling pressure from GBTC, as investors shifted toward more affordable alternatives. Despite this initial setback, the price trajectory swiftly corrected and continued its upward trend as institutional demand spiked over time.
These ETFs provide institutions with regulatory-compliant and affordable means to gain exposure to the crypto market beta, mitigating some concerns related to custodial and operational risks generally associated with crypto assets. The inflows into Spot ETFs reflect the market’s renewed confidence in BTC’s accessibility and legitimacy following the ETF approval, as evidenced by inflows into Spot ETFs, signaling the market’s renewed confidence in BTC’s accessibility and legitimacy.
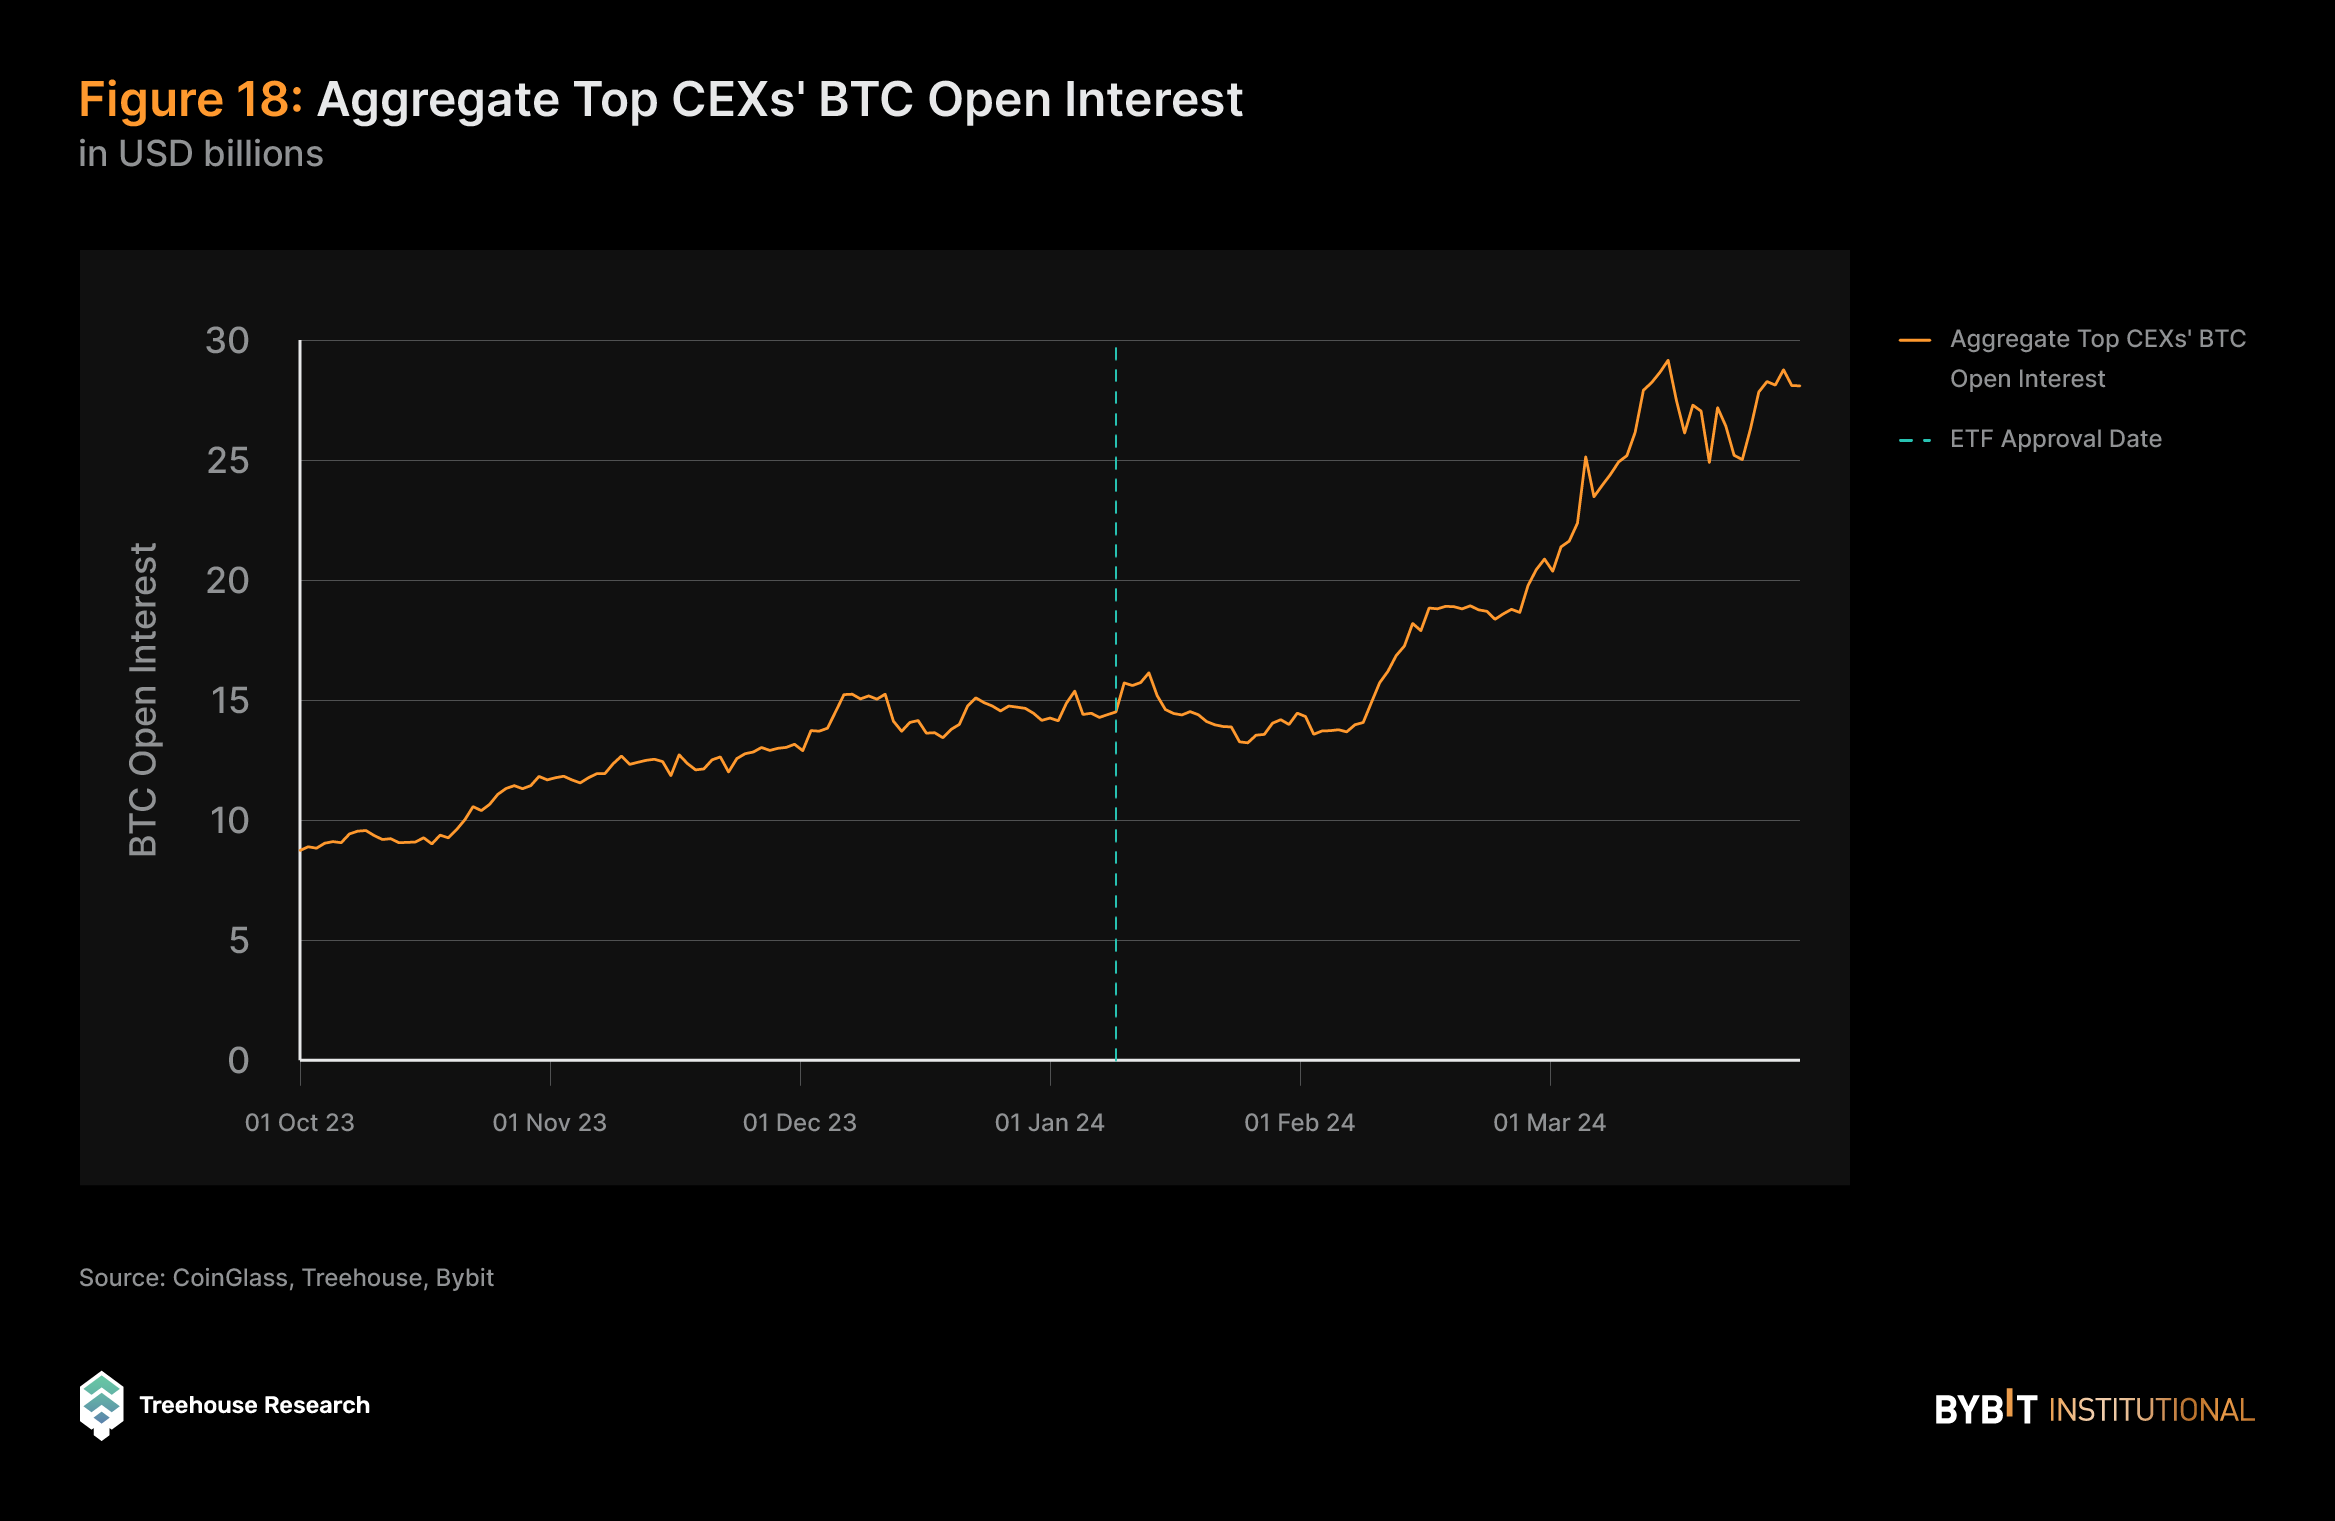
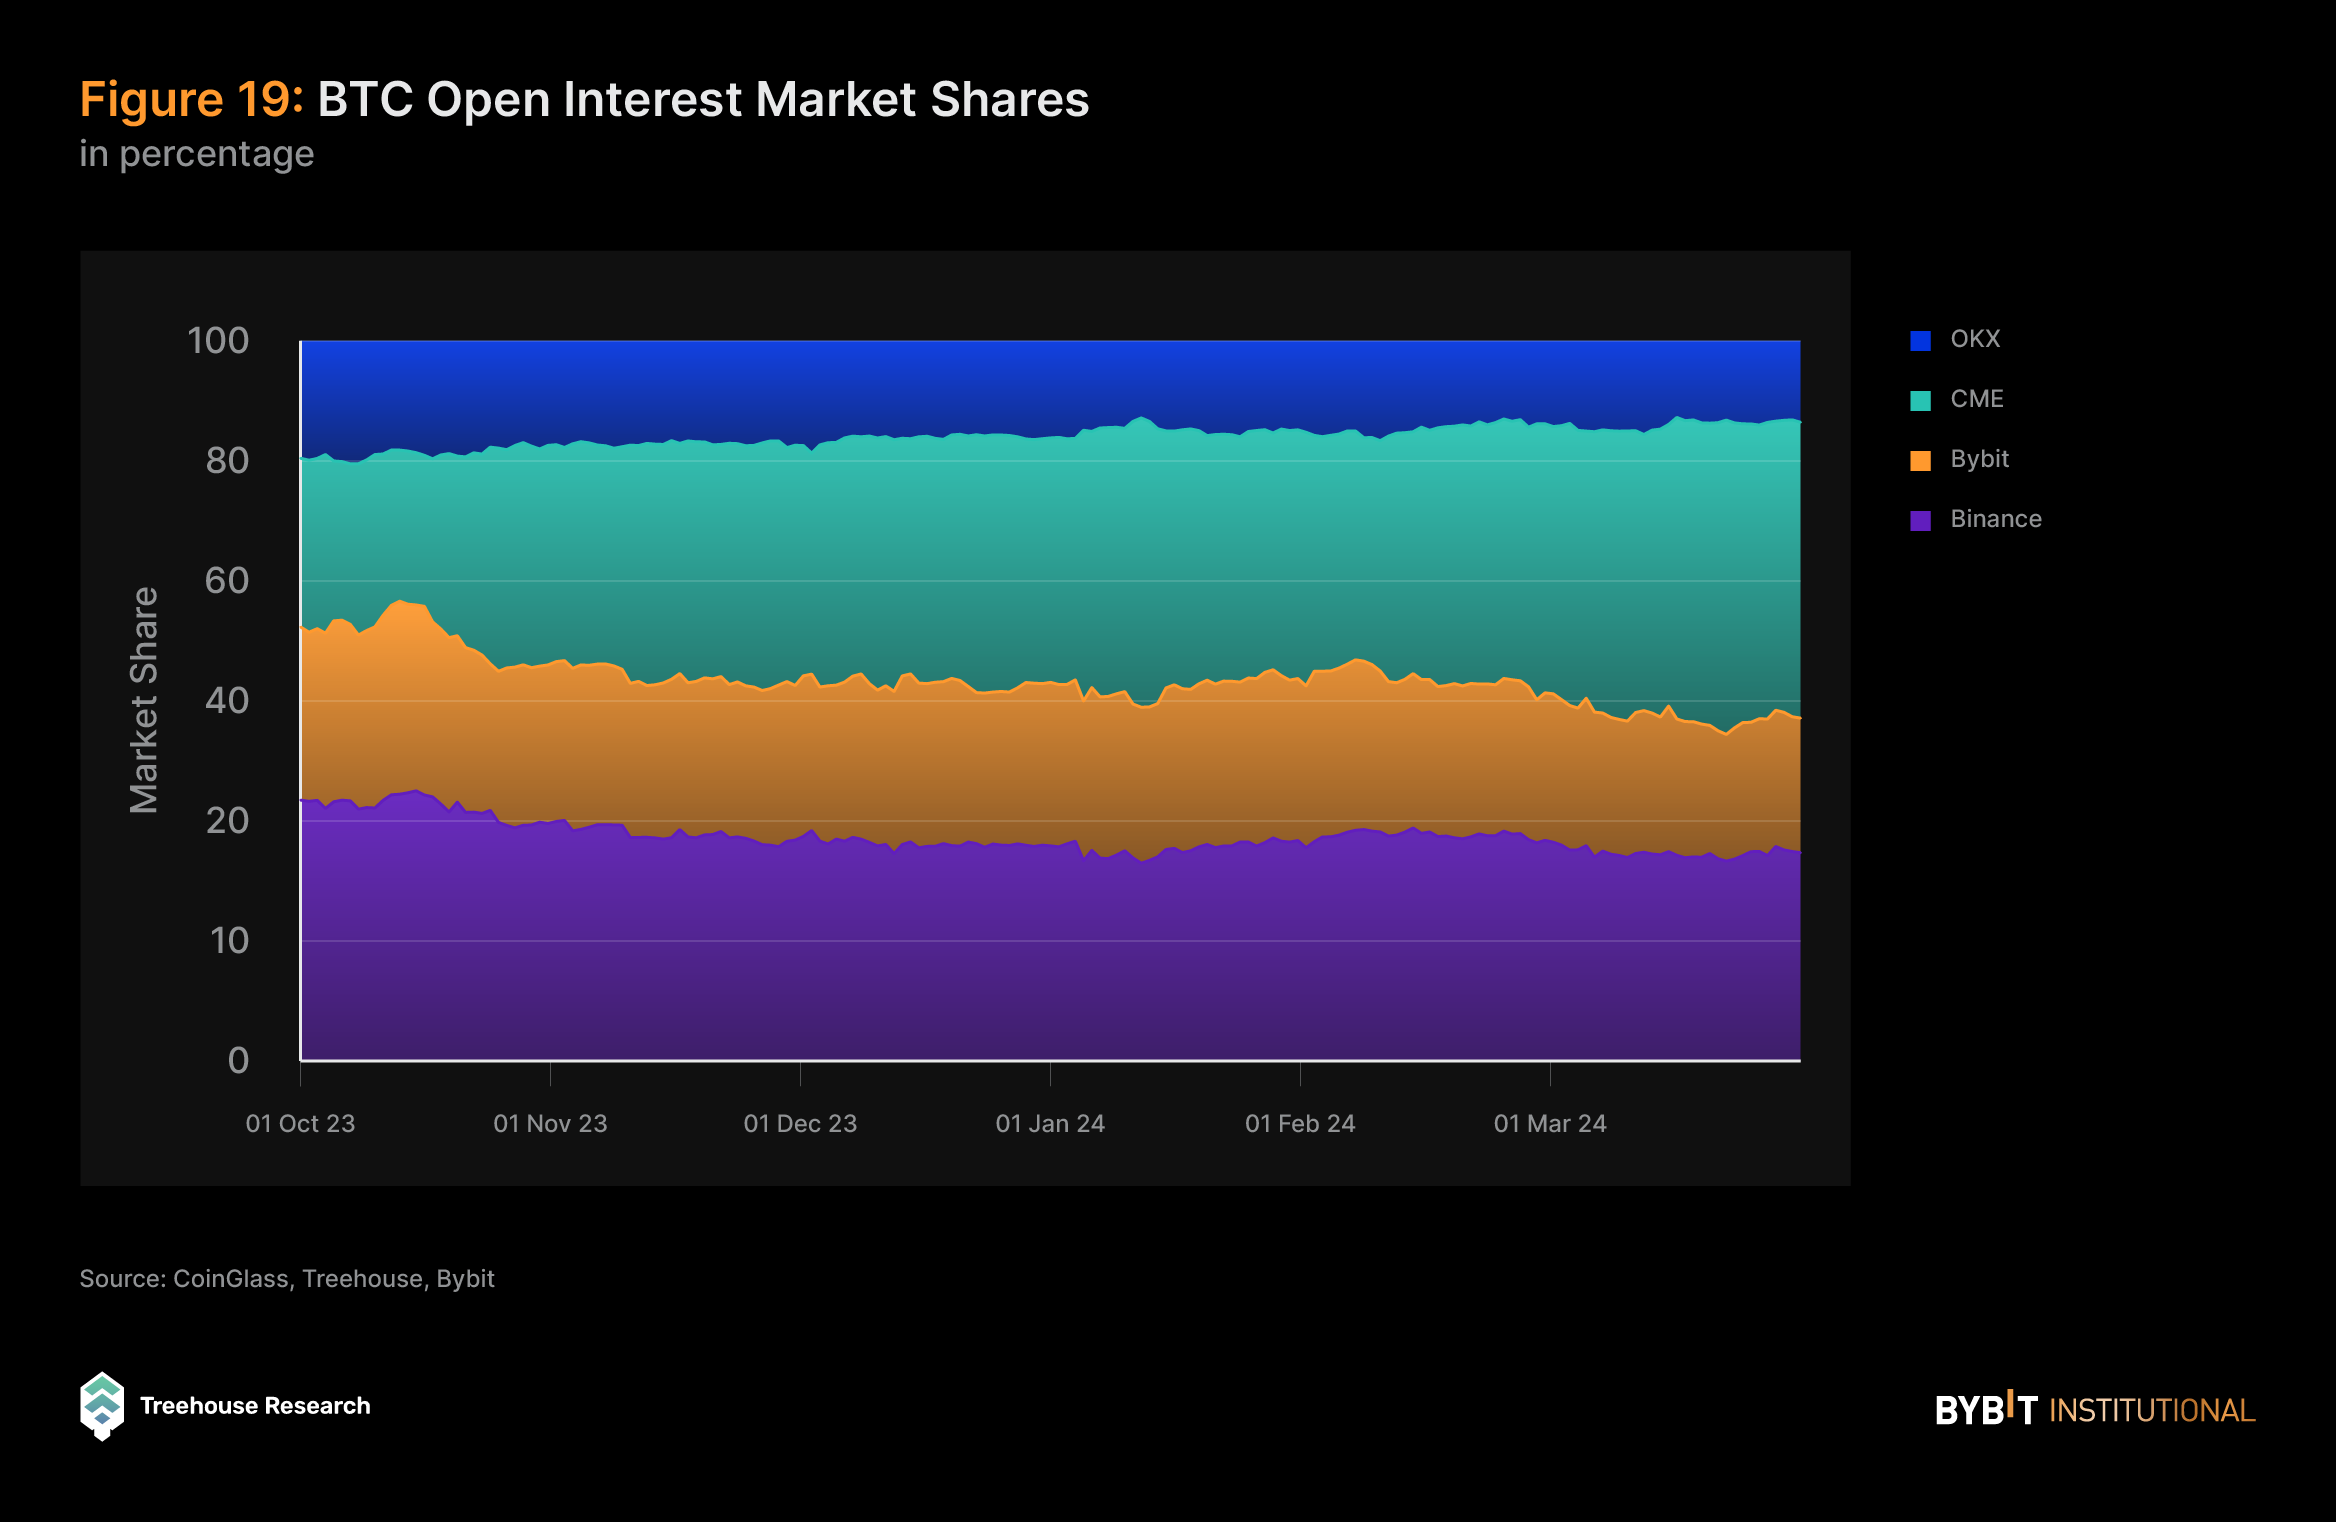
This trend is also exemplified by the significant increase in aggregate open interest (OI) for BTC, which strongly correlates with price movements and has seen over a 2x increase on the top exchanges. Further substantiating this notion is the observation that the exchange experiencing the highest growth in OI during this period is CME, a derivatives exchange primarily serving TradFi institutional clients. Over the same time frame, CME BTC OI surged by more than 5.5x, establishing itself as the largest exchange in terms of BTC OI in the market, with its market share rising from 23.45% to 41.10% of the top CEXs.
BTC On-Chain Metrics
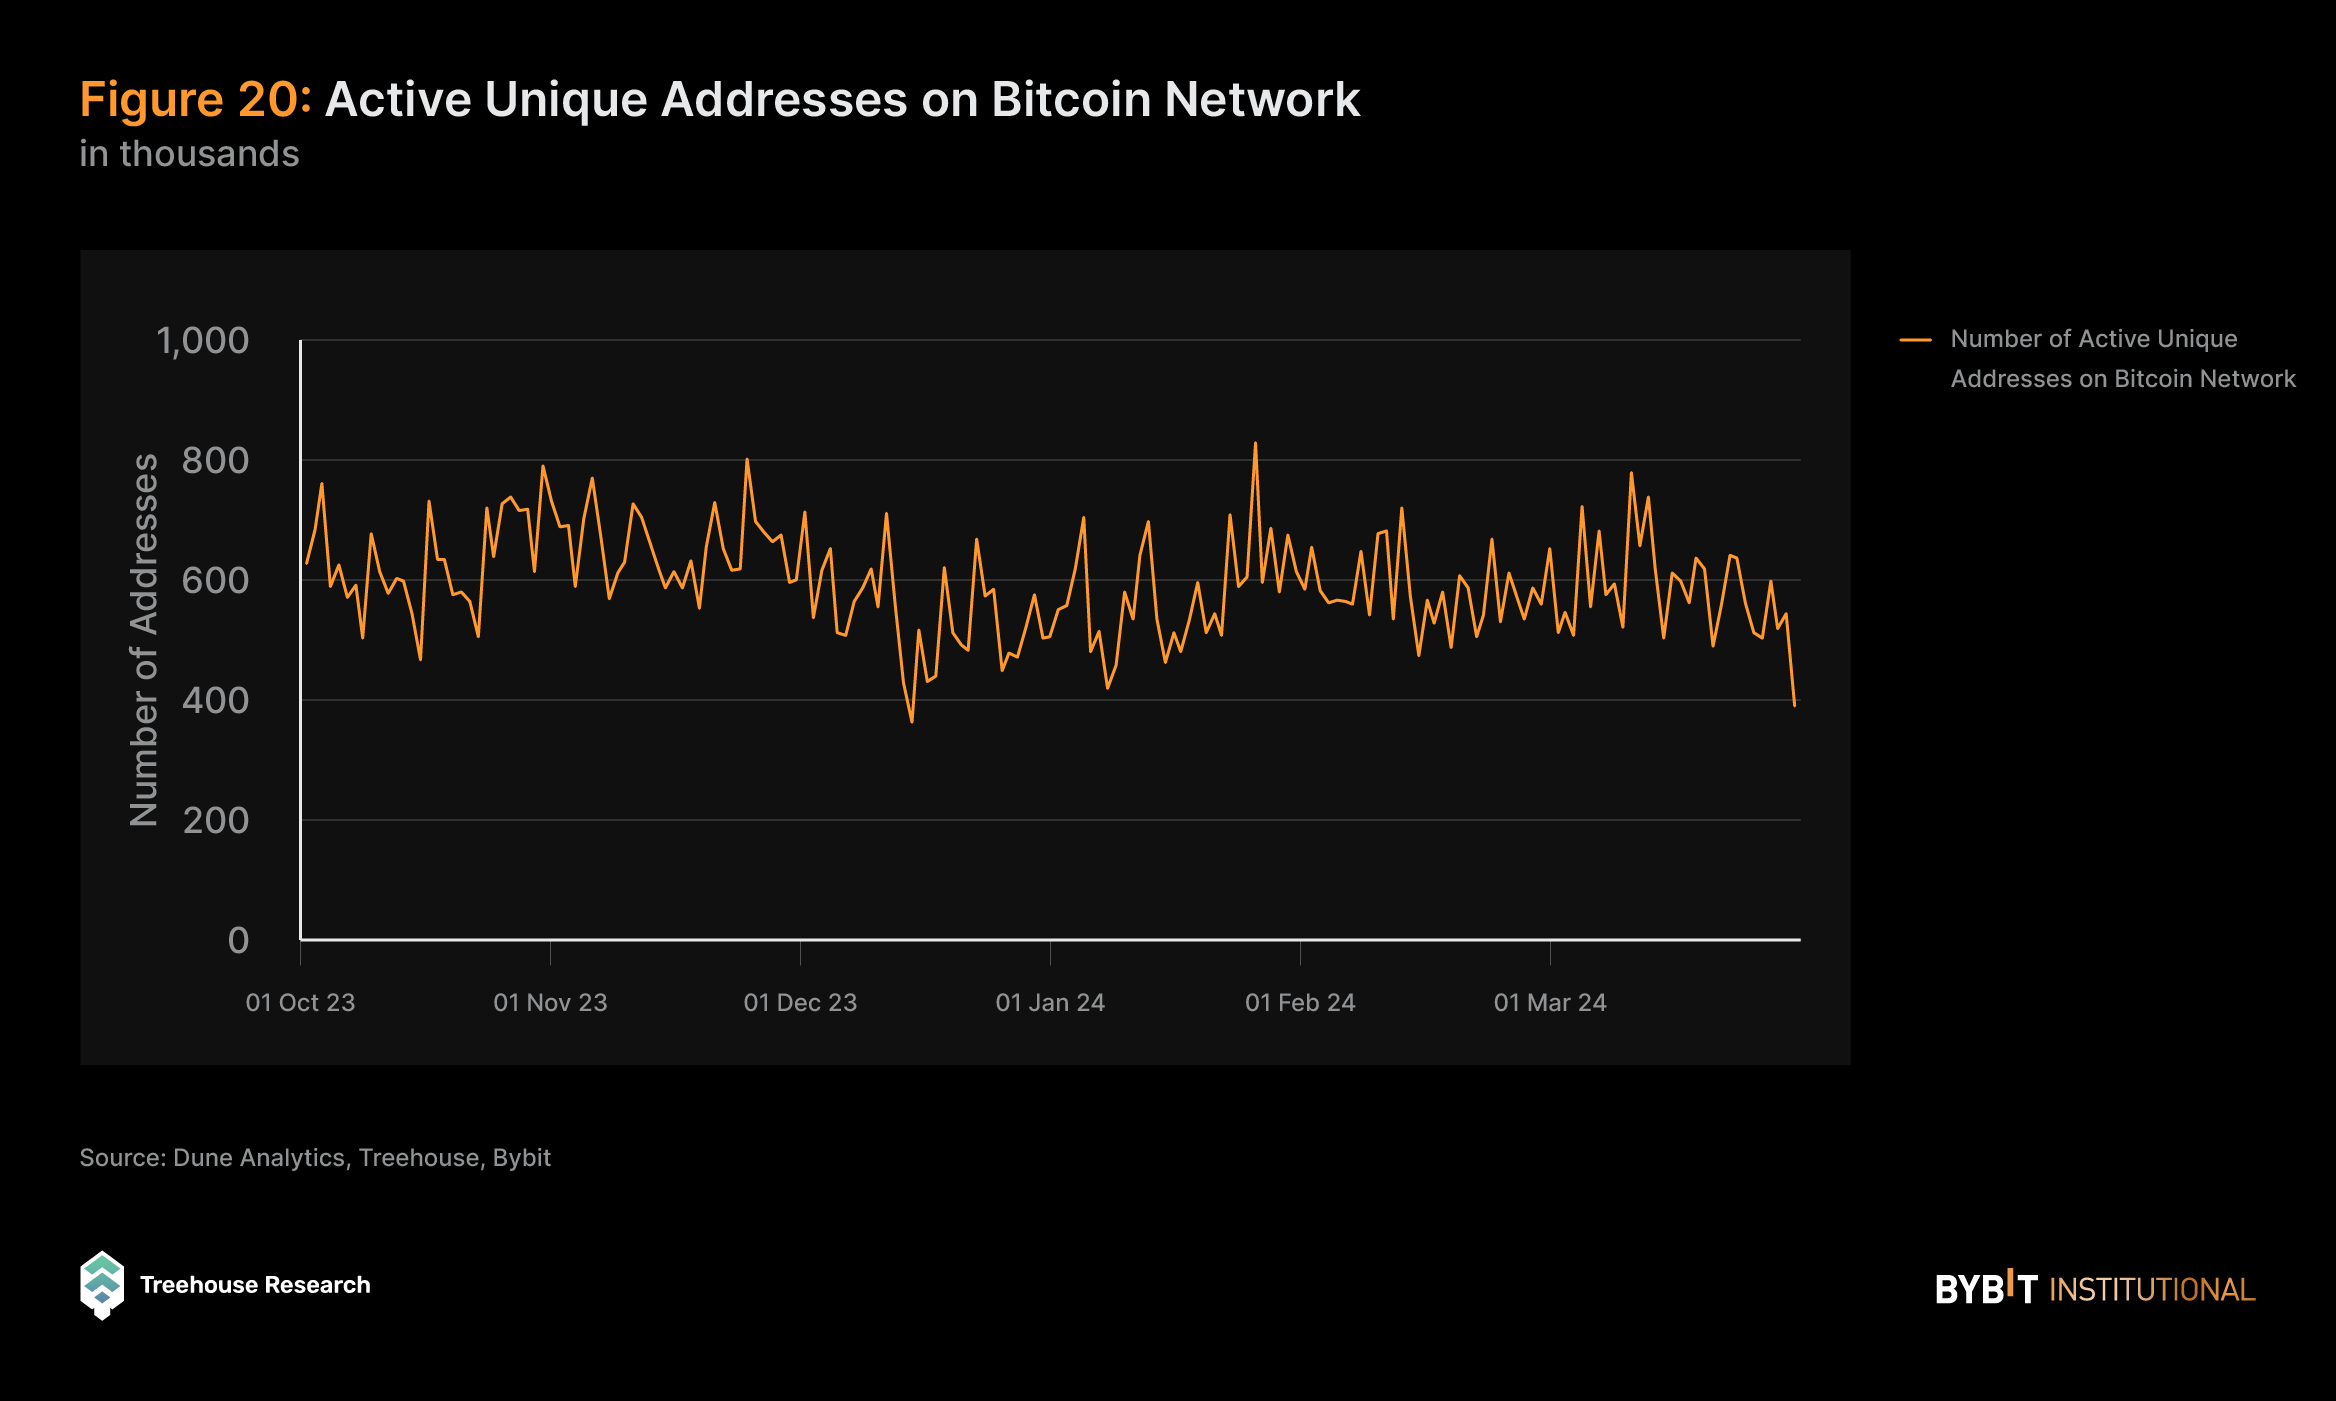
The number of unique active addresses on the Bitcoin network serves as a key indicator of user adoption and network engagement. In this regard, observed stability in active addresses since 2022 suggests a plateau in user activity and network participation. However, a notable spike in the number of unique active addresses was observed in September 2023, followed by a subsequent retracement. This spike could be attributed to various factors, such as a sudden surge in interest or activity in Bitcoin Ordinals/inscriptions. Additionally, the retracement could be linked to institutional movements of funds into BTC ETFs, which may have temporarily reduced the number of active addresses as funds were pooled into ETF holdings.
Increasing Security for the Network
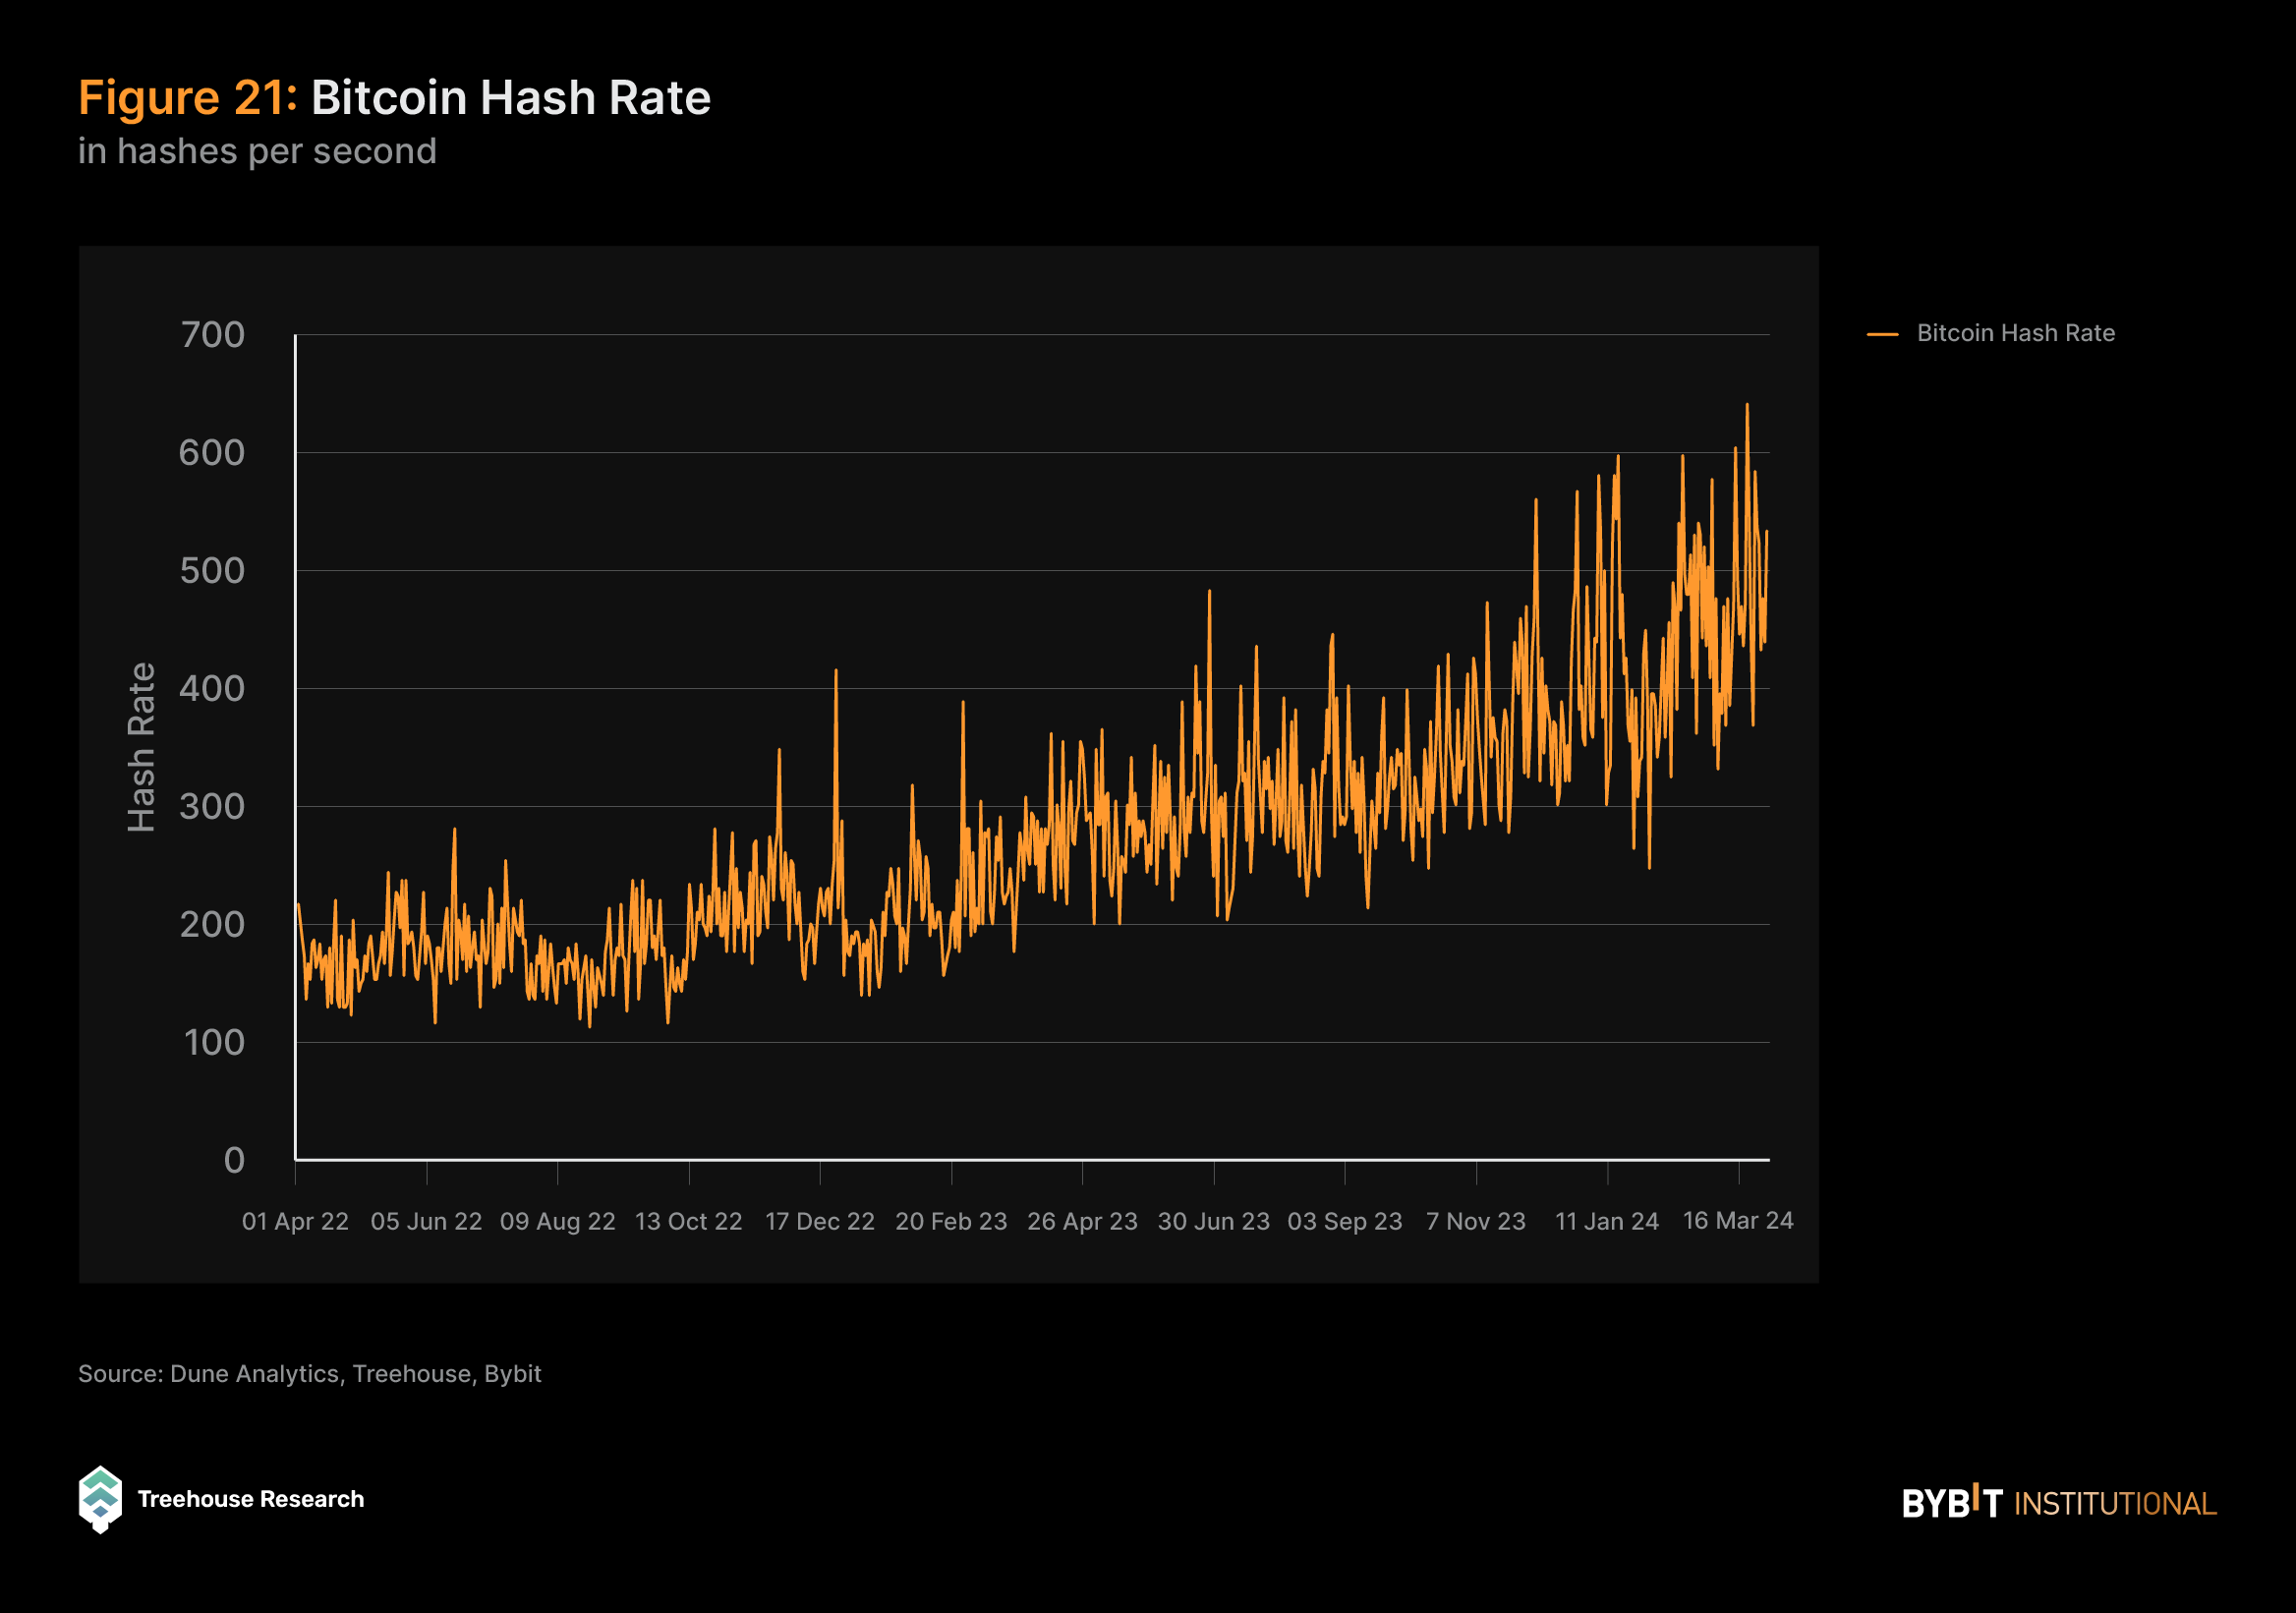
The hash rate of Bitcoin quantifies the total computational effort expended on BTC mining and transaction processing, with a higher hash rate denoting enhanced network security. The substantial elevation of the hash rate to record highs over time showcases the robust security of the Bitcoin network, as well as an increasingly fortified defense against attacks, and affirms investor confidence in the system’s integrity and long-term viability.
Number of BTC Addresses by Holding Amounts
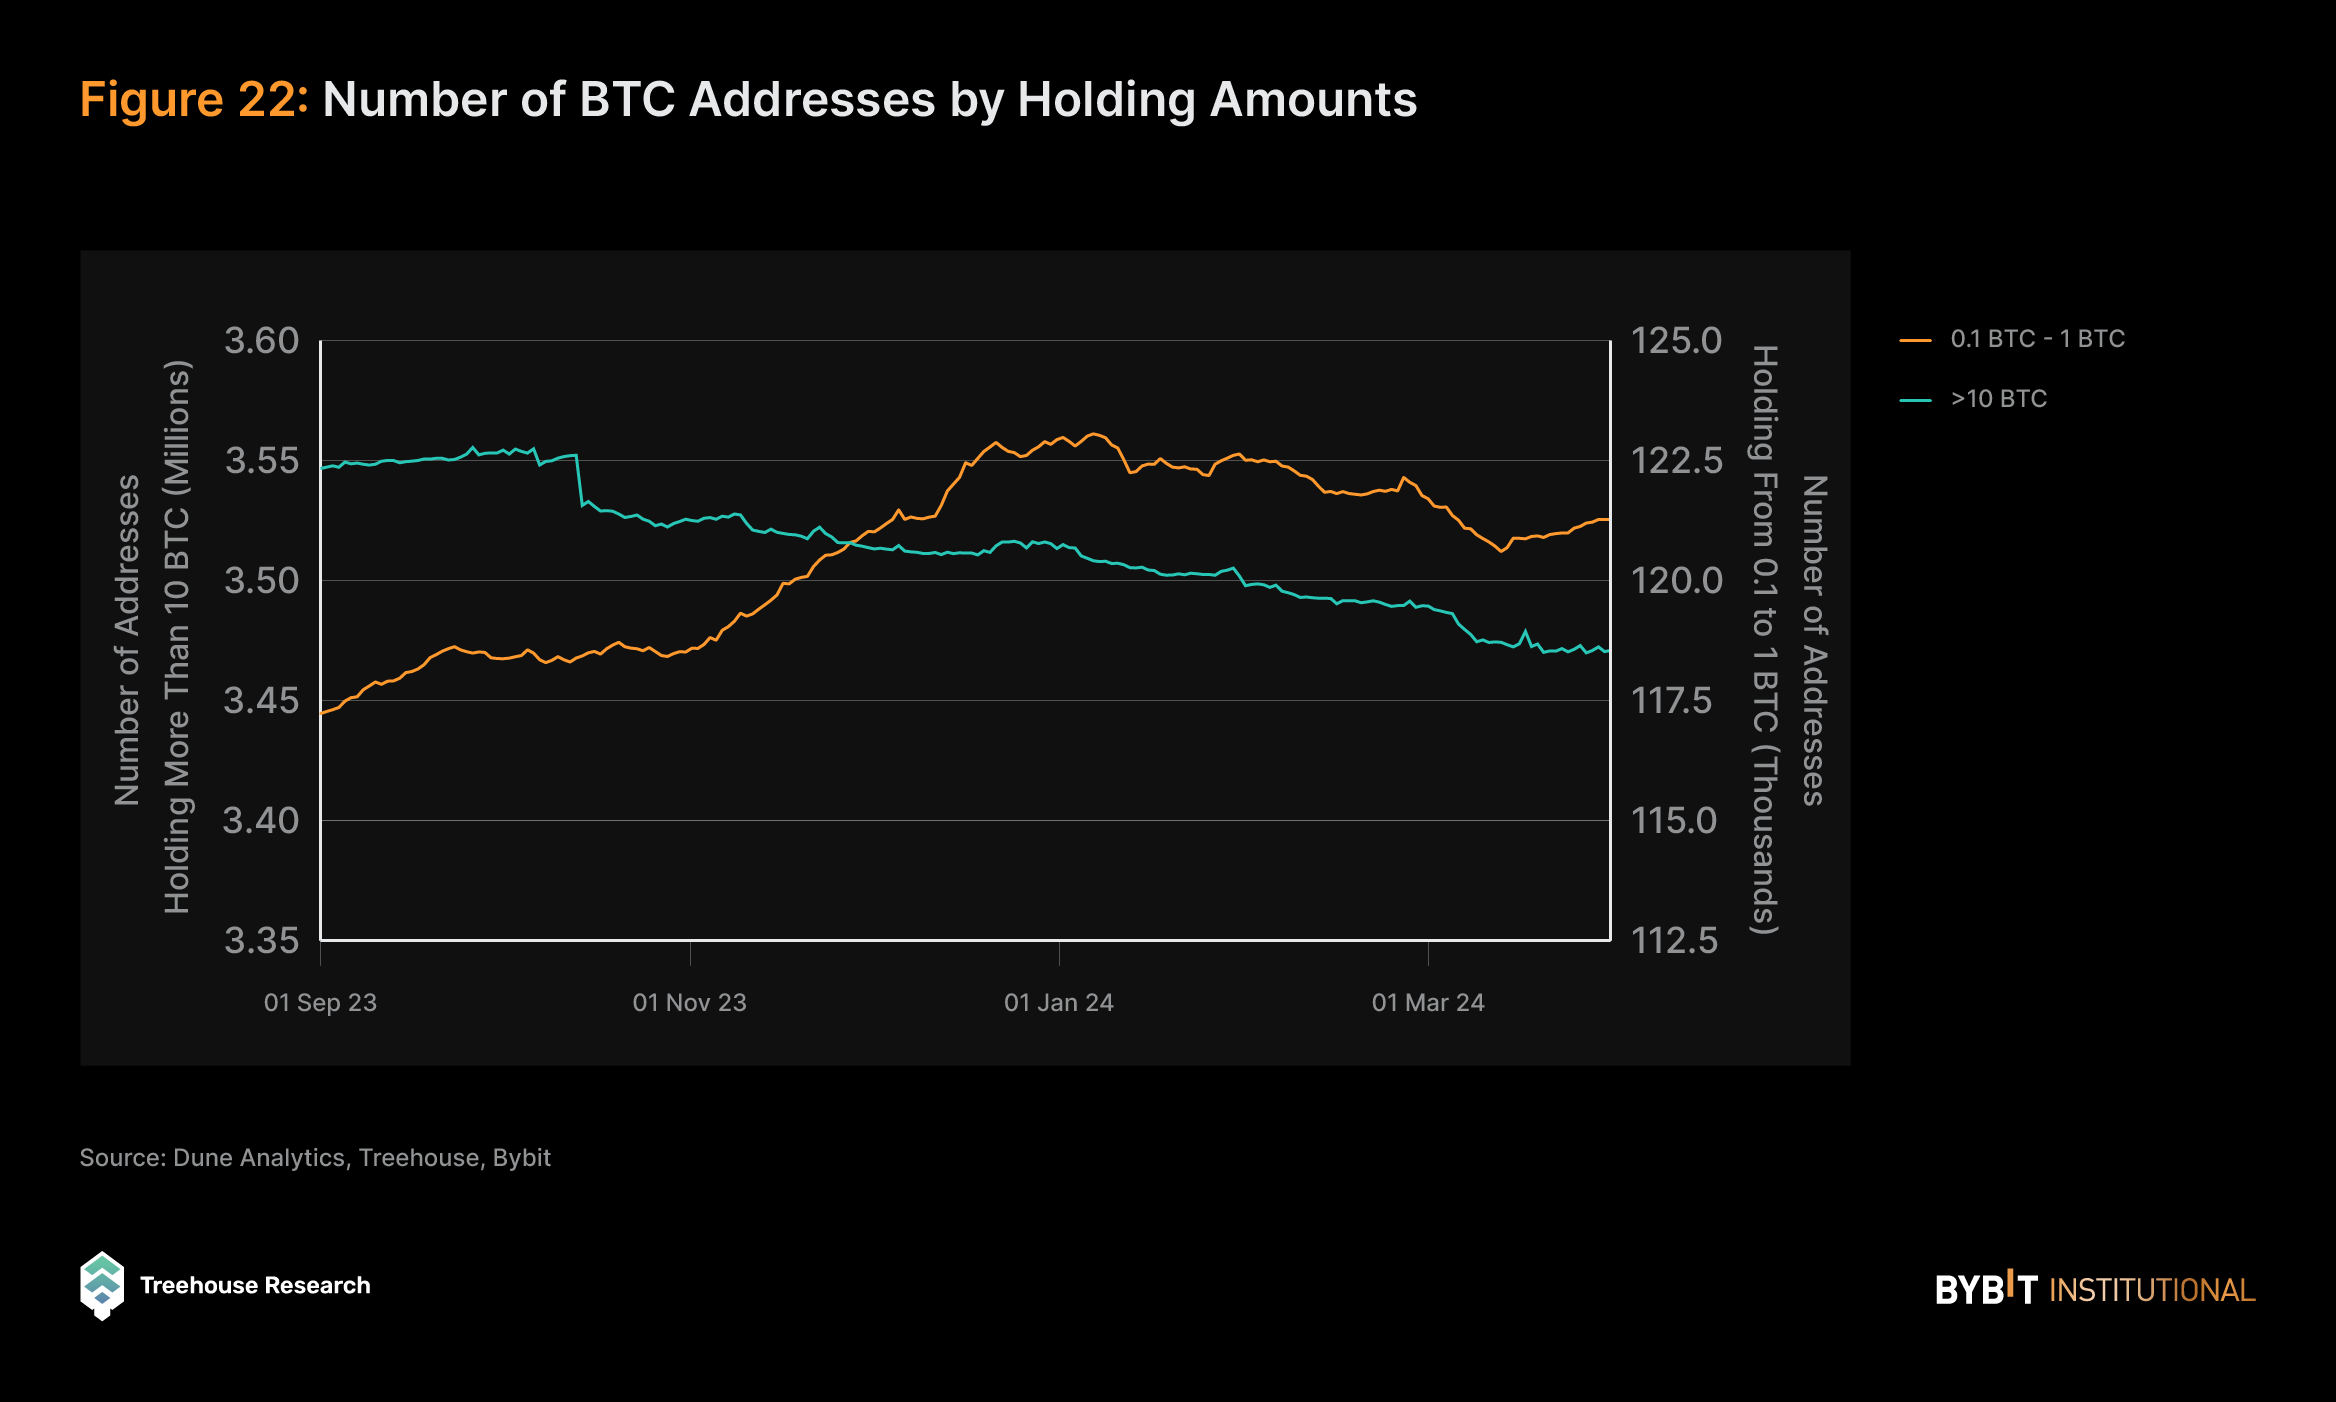
The shifts in the number of addresses across various BTC ownership tiers also align with broader market movements. Specifically, there has been a modestly positive growth rate of 2.3% in addresses holding 0.1 to 1 BTC, while there’s been a decline of 3.09% in addresses holding more than 10 BTC. These changes may reflect the interplay between retail and institutional investors in response to BTC price surges and Spot ETF approvals. As the price of BTC increases, smaller holders enter the market, attracting new retail investors seeking to capitalize on the upward momentum. Meanwhile, larger institutional investors may be reallocating their capital from self-custodial wallets to ETF holdings in order to transfer certain risks to the ETF issuers, while retaining BTC exposure in a more regulatory-compliant manner.
Miners Are Taking Profits on the Price Surge
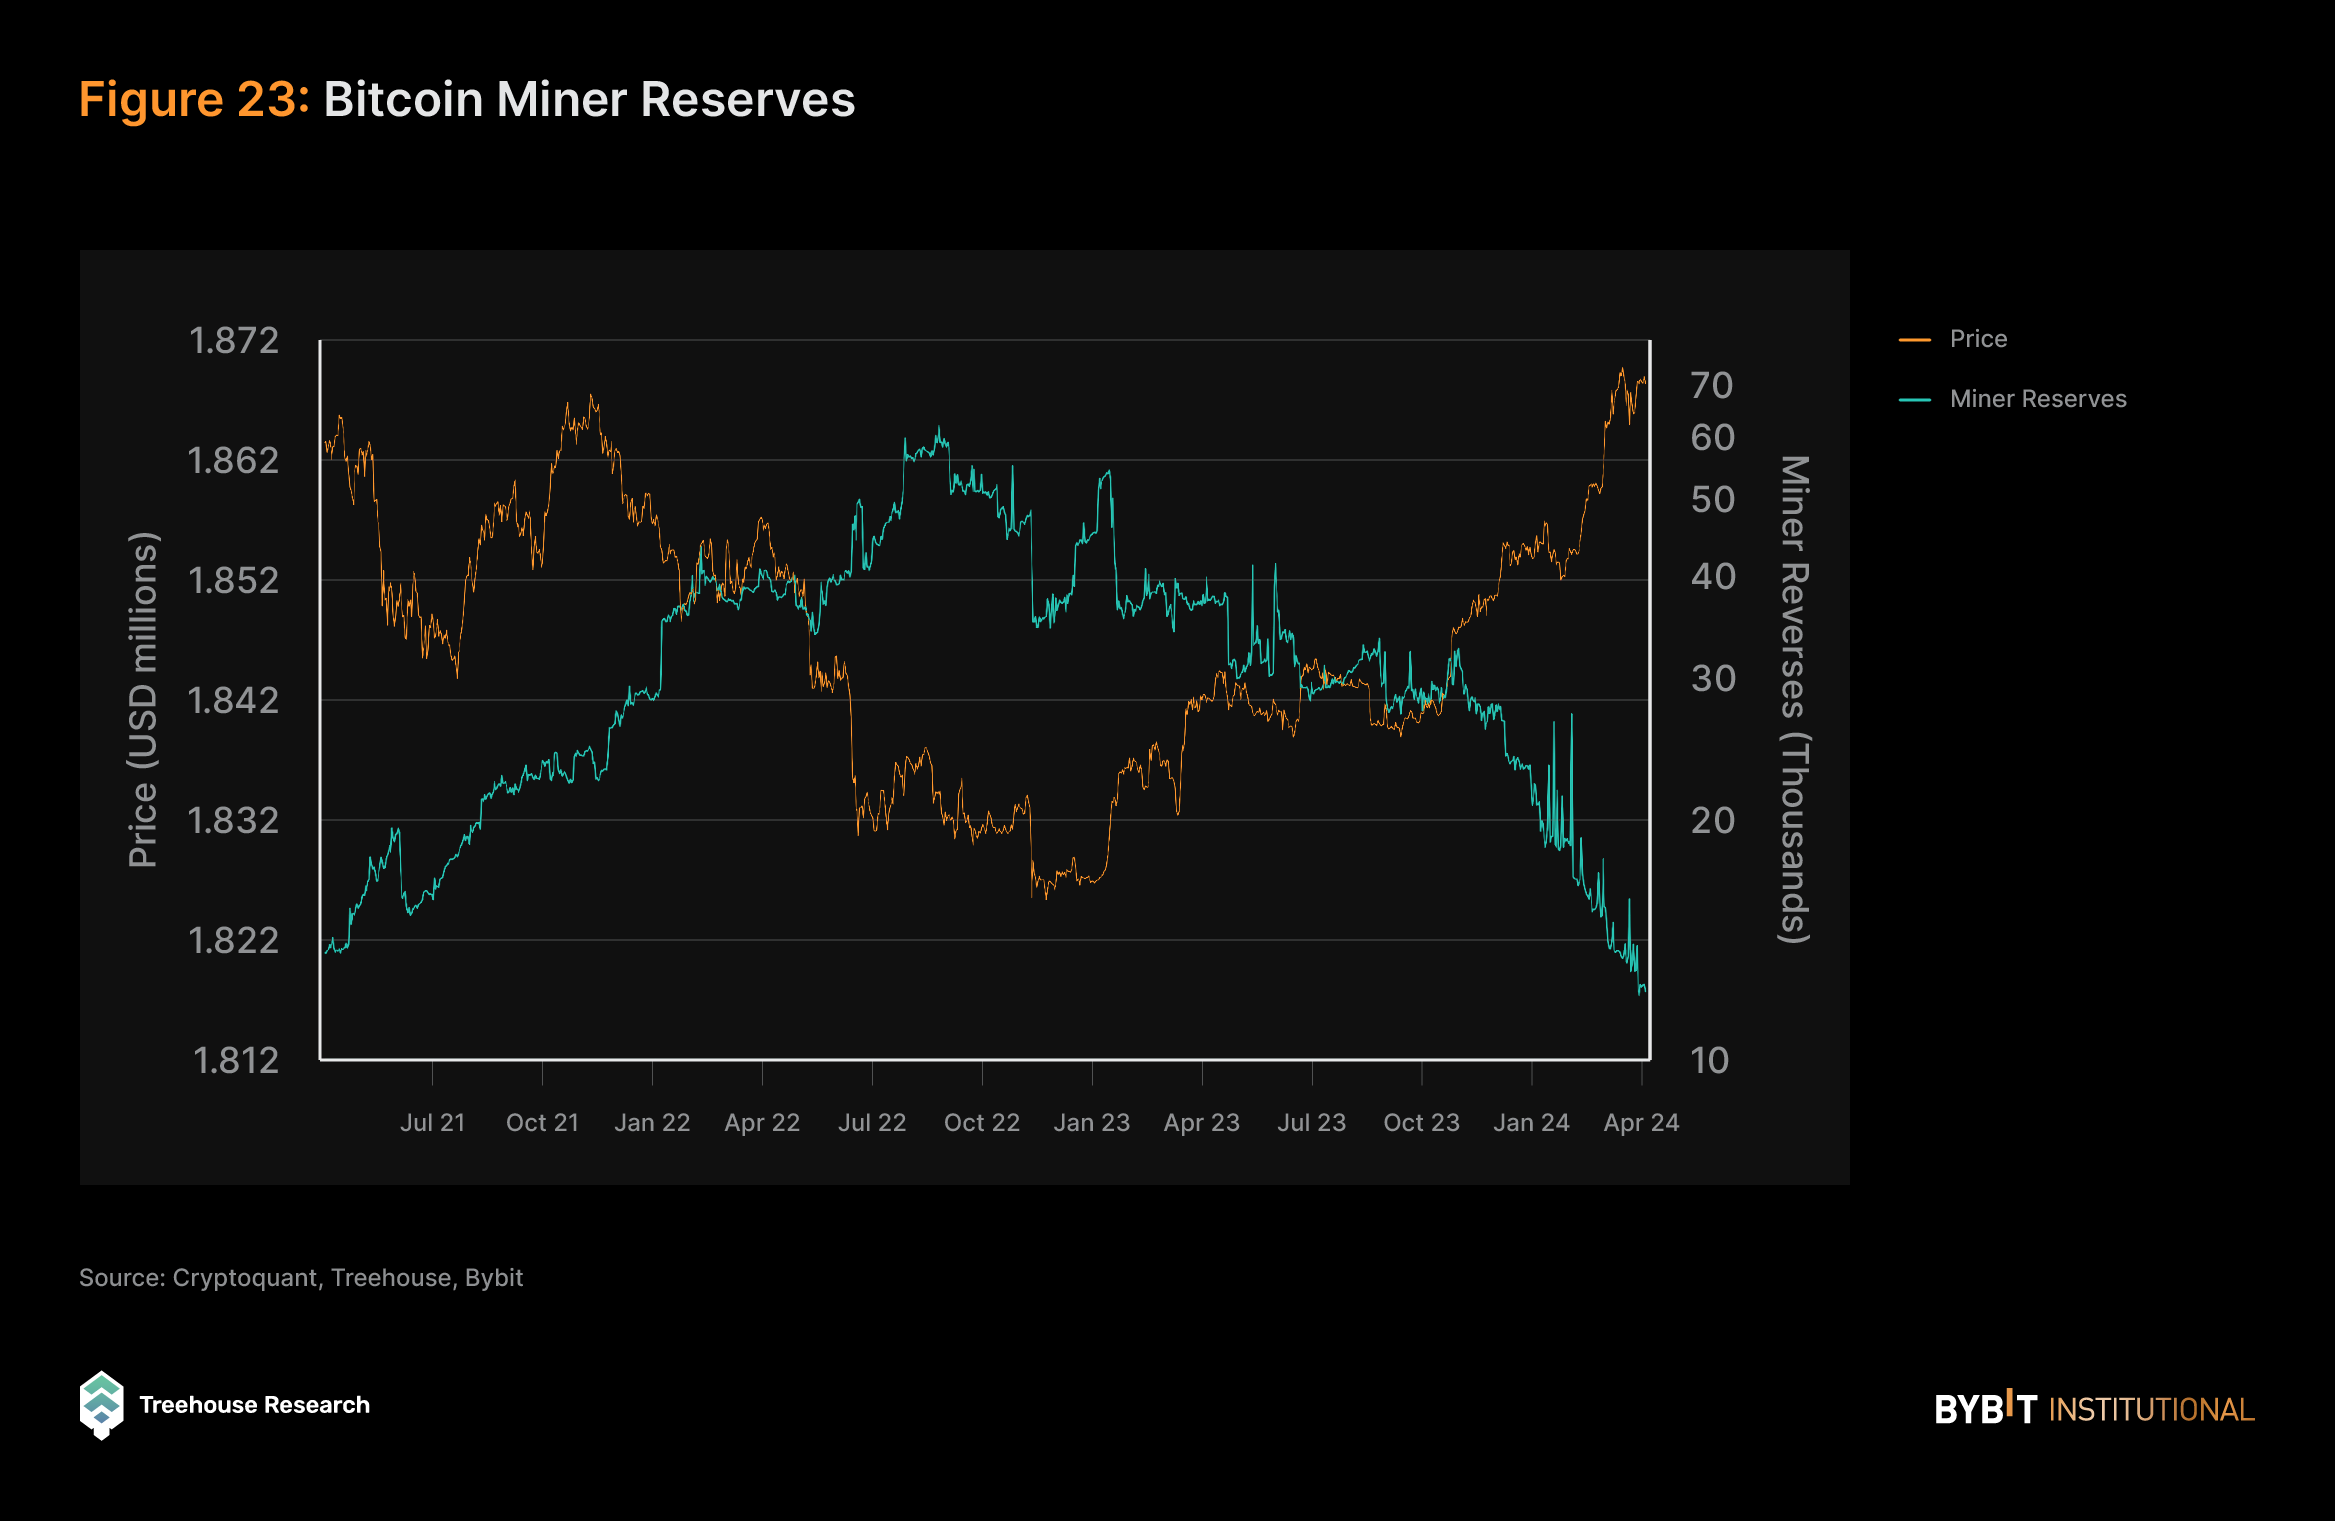
Bitcoin miner reserve data indicates a substantial decline in BTC reserves held by miners over the past year, indicating significant selling pressure from miners as they capitalize on the rising price of BTC by selling their newly mined coins. This inverse correlation between BTC price and miners’ reserves underscores the selling pressure exerted by miners as BTC’s value increases. The trend could introduce added market friction, potentially impacting Bitcoin’s upward trajectory as prices continue to climb.
ETH On-Chain Metrics
Number of Validators
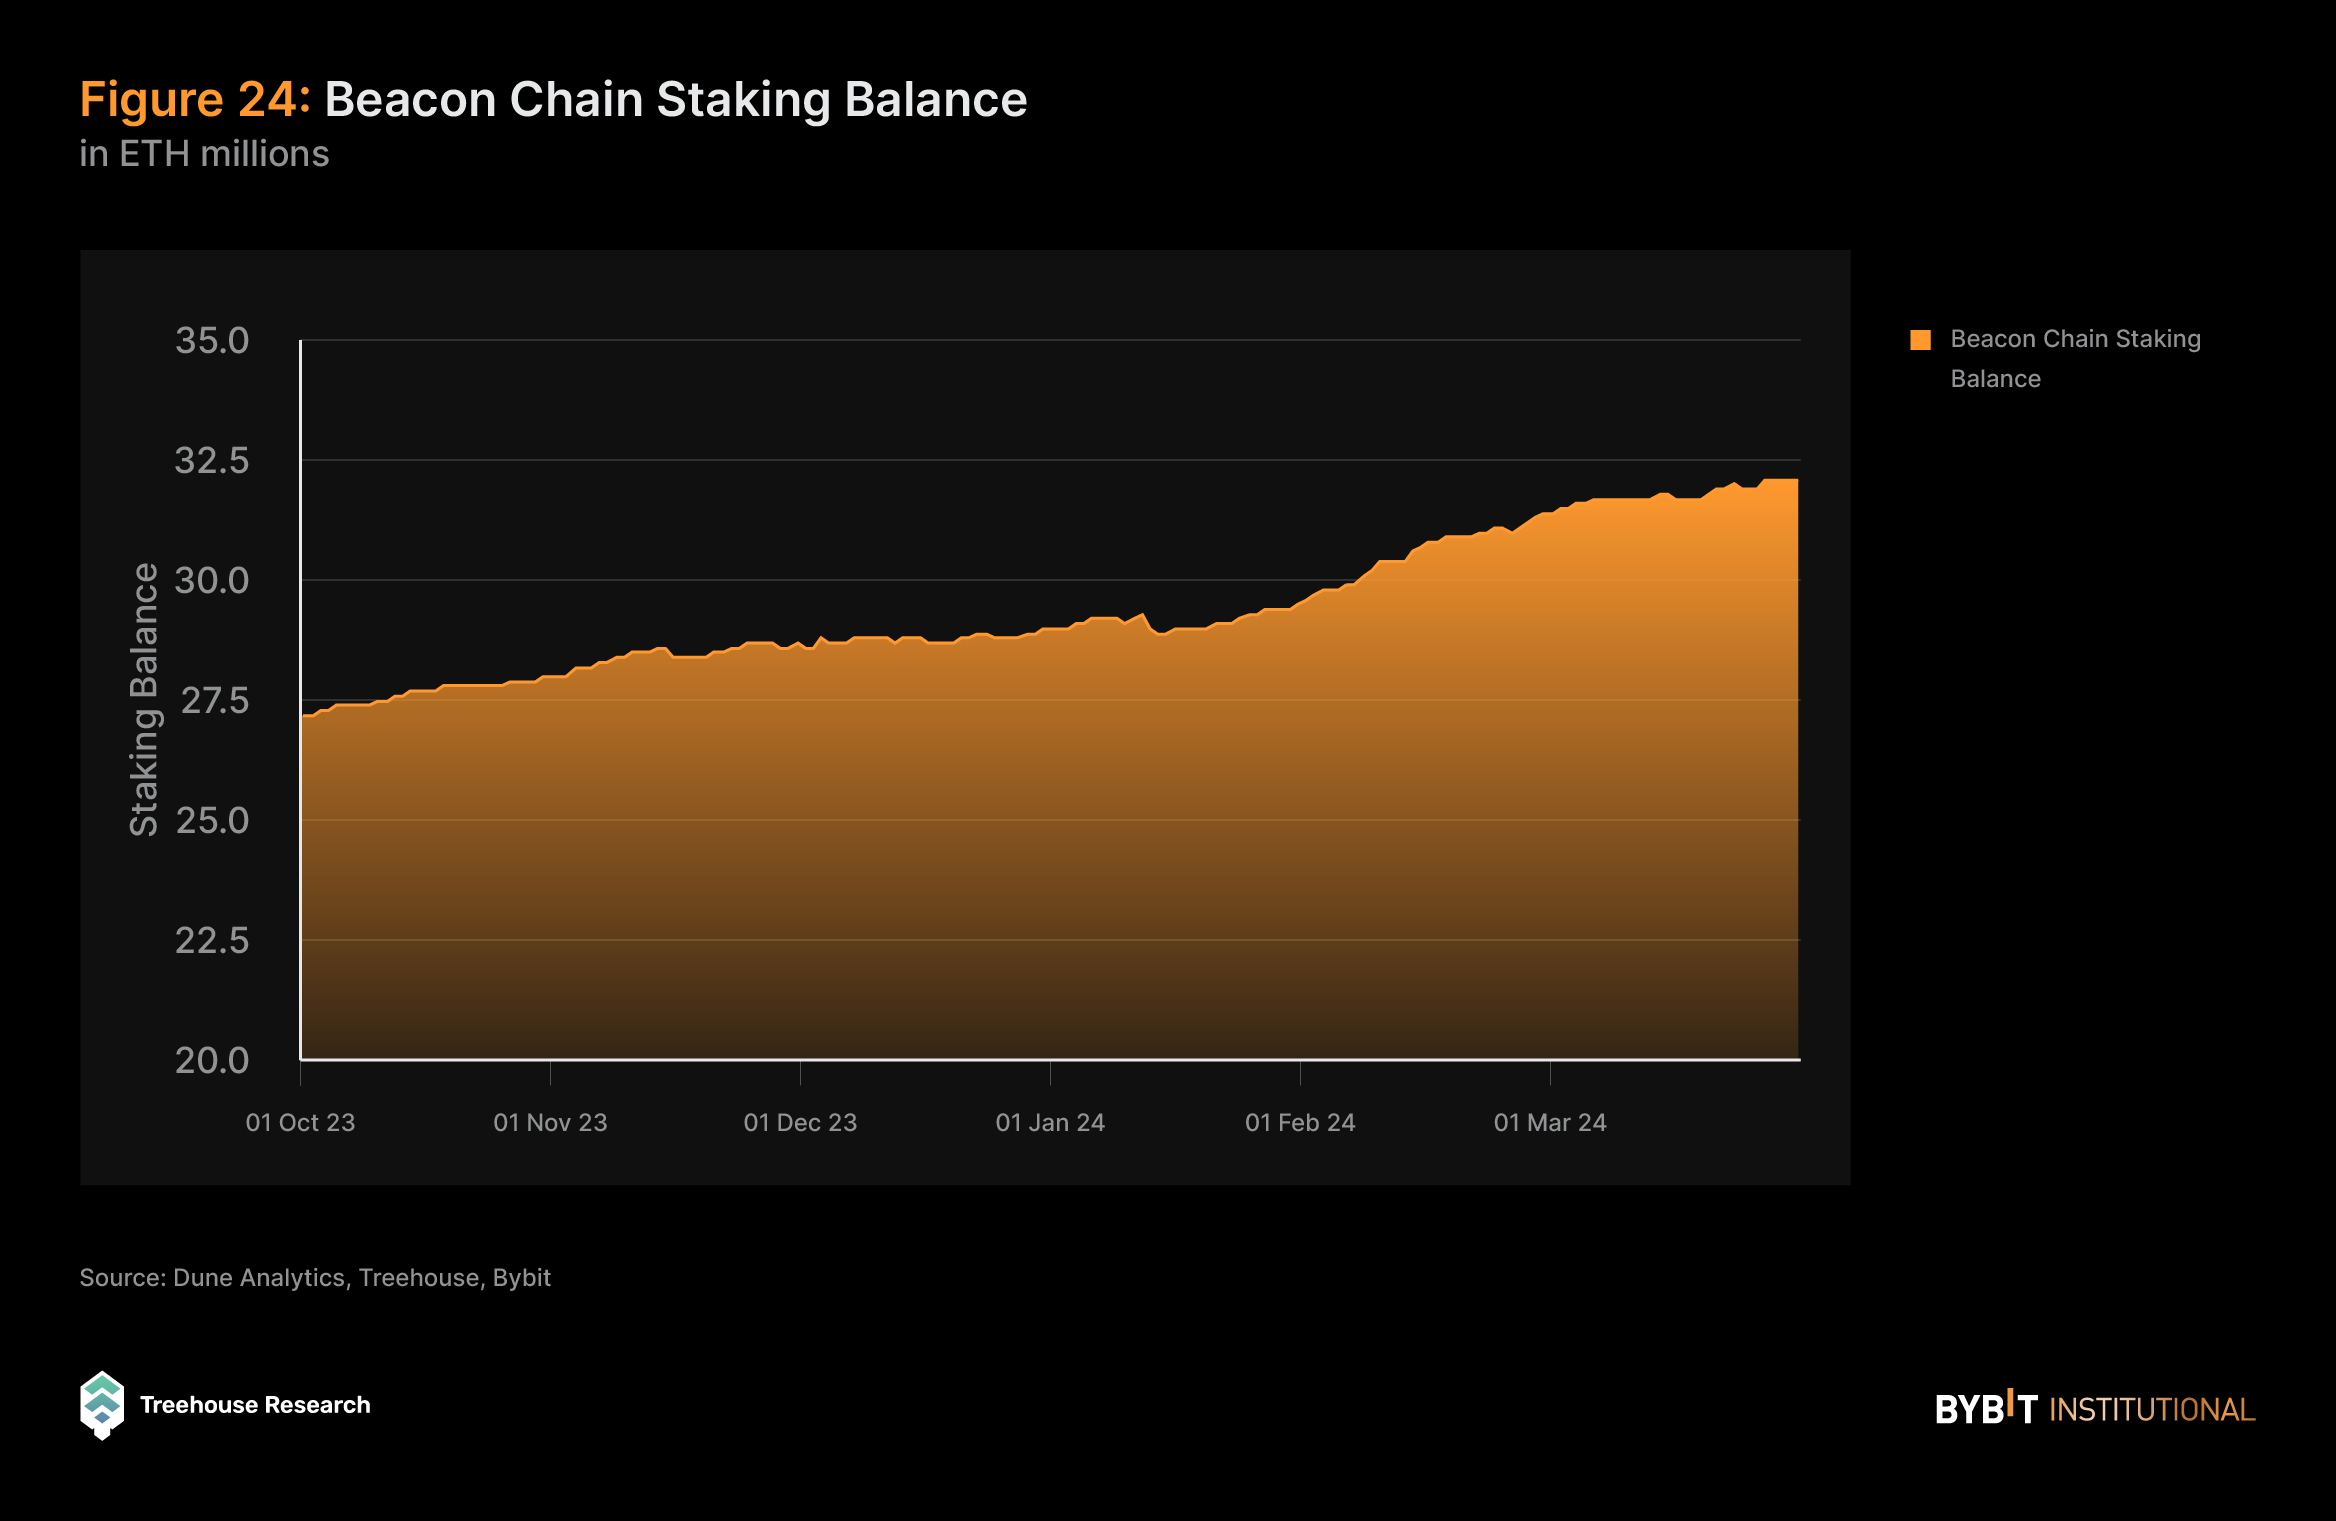
The continuous expansion of the ETH staking market highlights the growing trust in Ethereum’s network. This is evident from the rising staking ratio and the increasing ETH balance on the Beacon Chain, which indicate a growing conviction in Ethereum’s proof of stake (PoS) model, as well as a growing confidence in the value proposition of ETH as an asset to be staked for yields.
As more participants choose to lock their ETH holdings for staking rewards, it reflects a broader belief in the long-term viability and security of the Ethereum network, contributing to its overall resilience and growth.
Unique Active Addresses on Ethereum
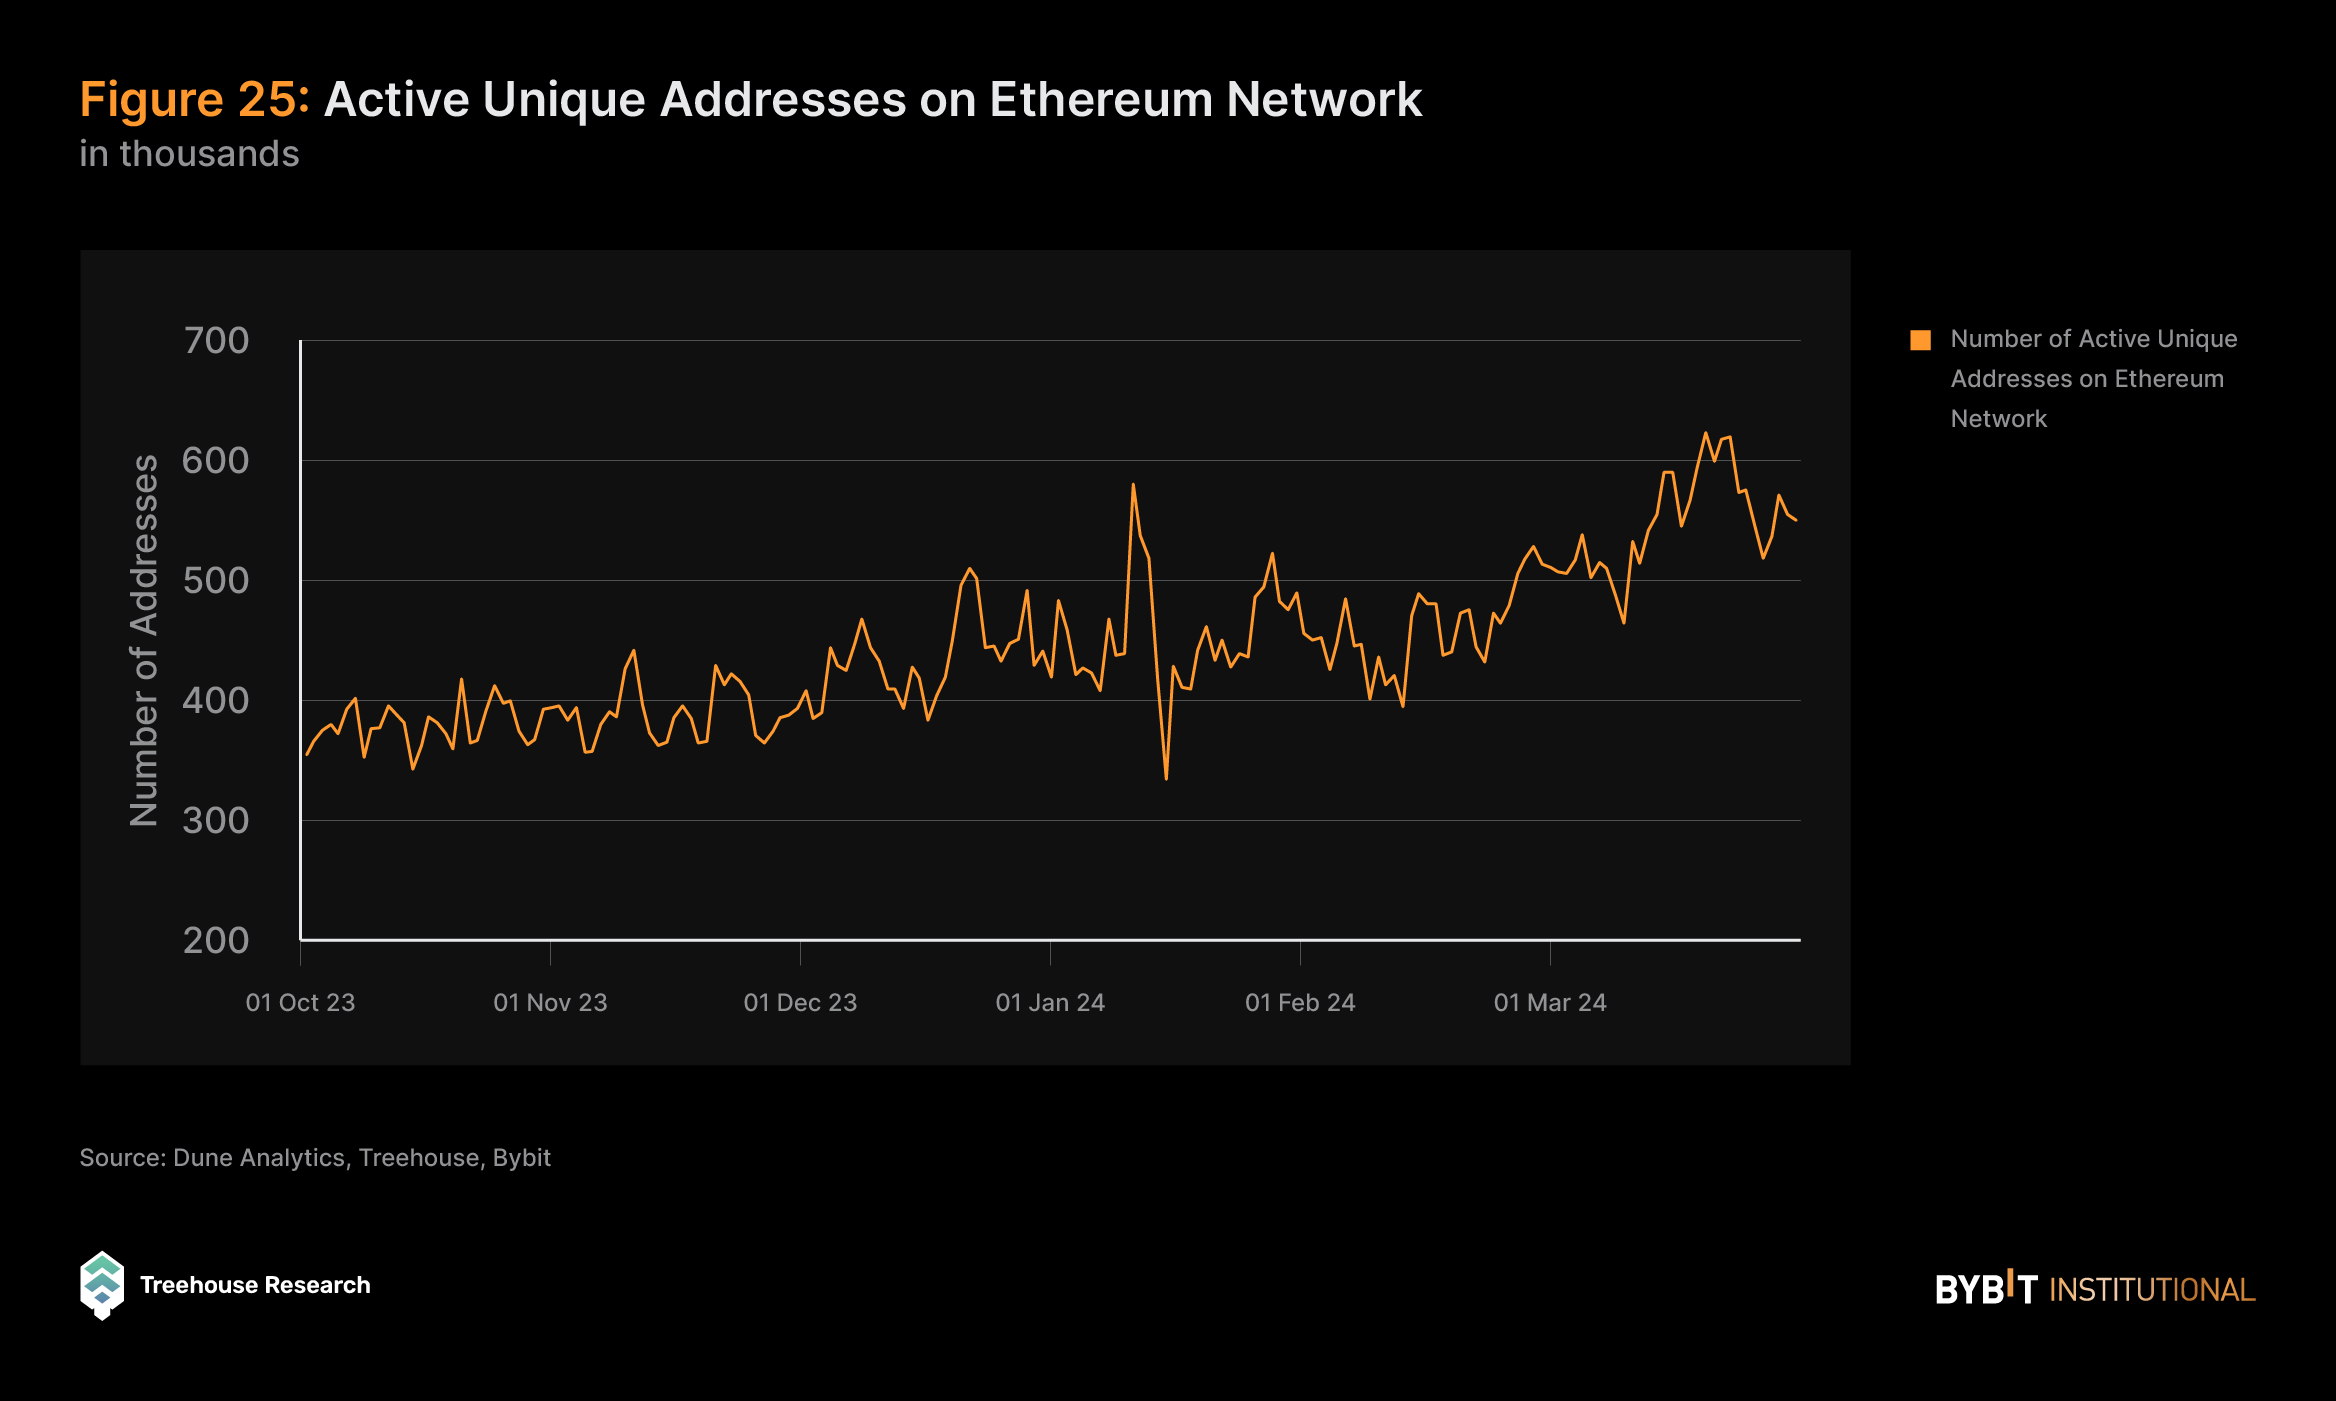
The number of unique active addresses on Ethereum, encompassing both senders and receivers in transactions, serves as another important metric for gauging the network’s vitality and adoption. For investors, this metric signals Ethereum’s growing utilization and the rising interest in its decentralized applications (DApps), smart contracts, and services. The observed increase in unique active addresses on Ethereum’s network signifies growing user engagement and network utilization, which potentially indicates a healthy uptick in adoption.
Ethereum Gas Fees
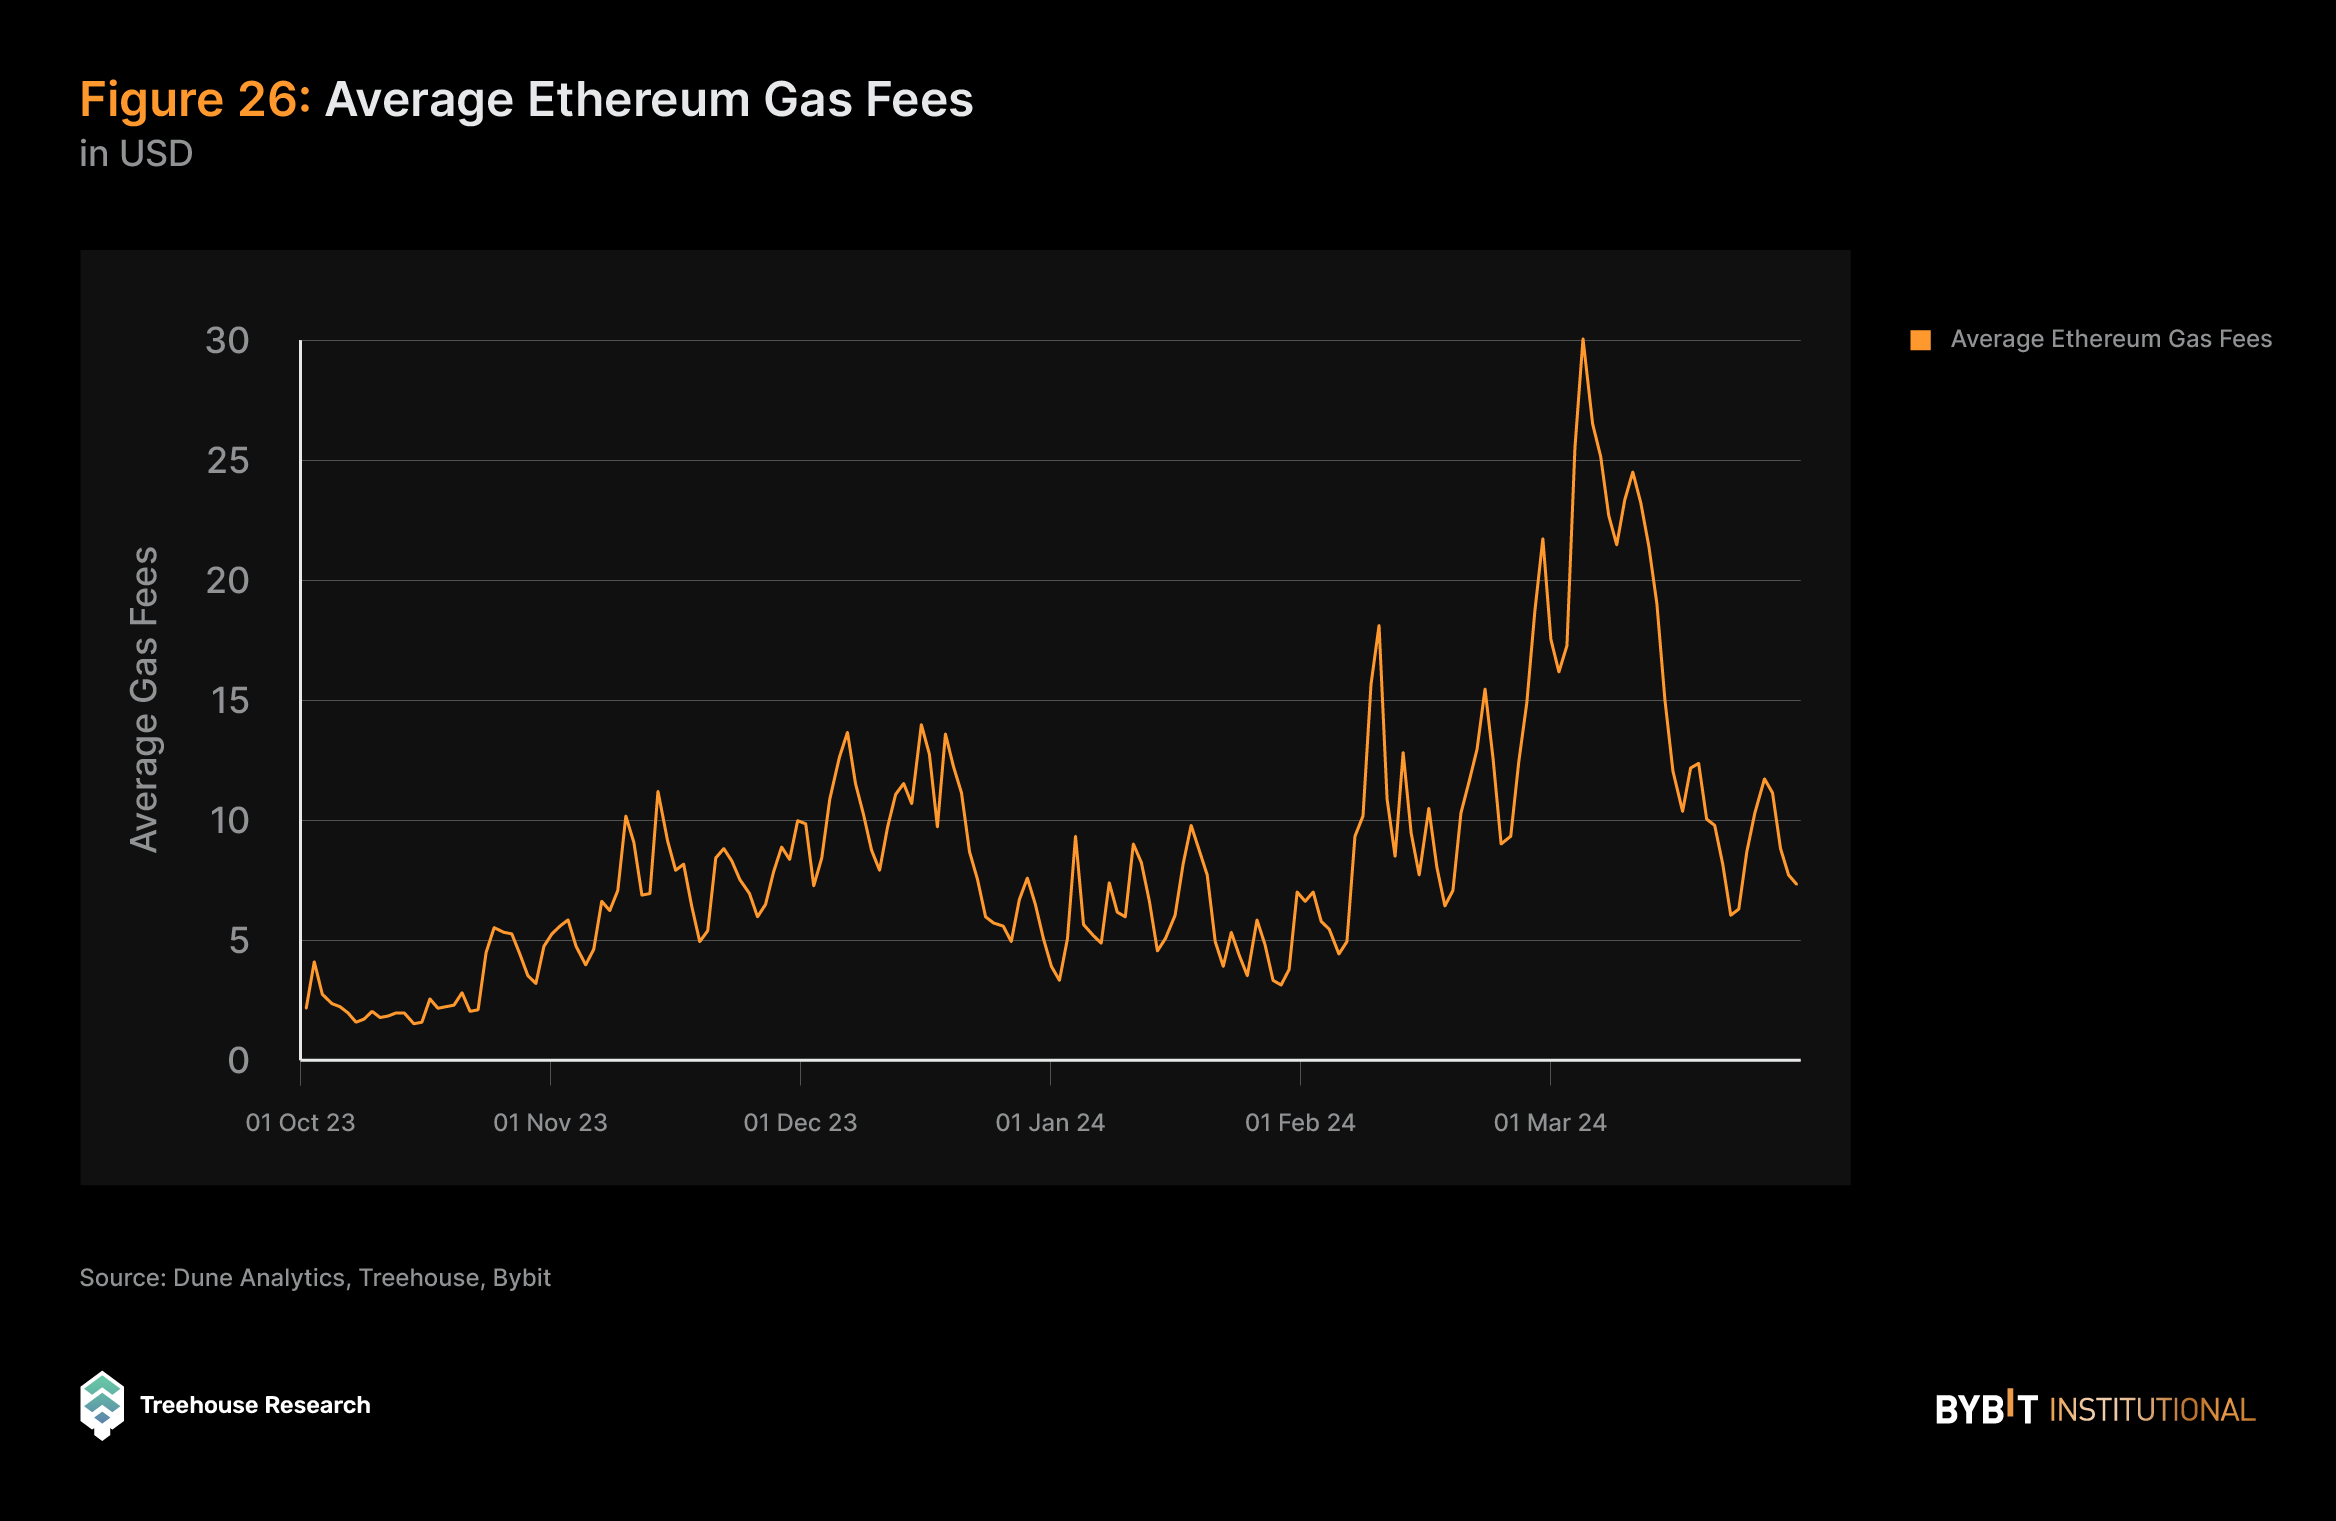
Ethereum gas fees are the costs users pay to process transactions or execute smart contracts on the Ethereum network. These fees are a crucial part of using the Ethereum blockchain and affect the cost of your transactions. High gas fees can have a significant impact on the profitability of transactions, especially if you’re conducting frequent trades or executing complex smart contracts. Average gas prices can be as high as $200 per transaction, so it’s important for traders to track these fees when making trades on Ethereum-based chains.
Additionally, the rising average Ethereum gas fees may suggest bullish trends in the cryptocurrency market, as observed during the DeFi Summer of 2021 when gas prices escalated to an average of $63 per transaction. This pattern suggests that increased network activity and demand for Ethereum-based transactions are closely linked to broader market optimism and growth phases in the cryptocurrency sector.
Beginning of the Bull Cycle
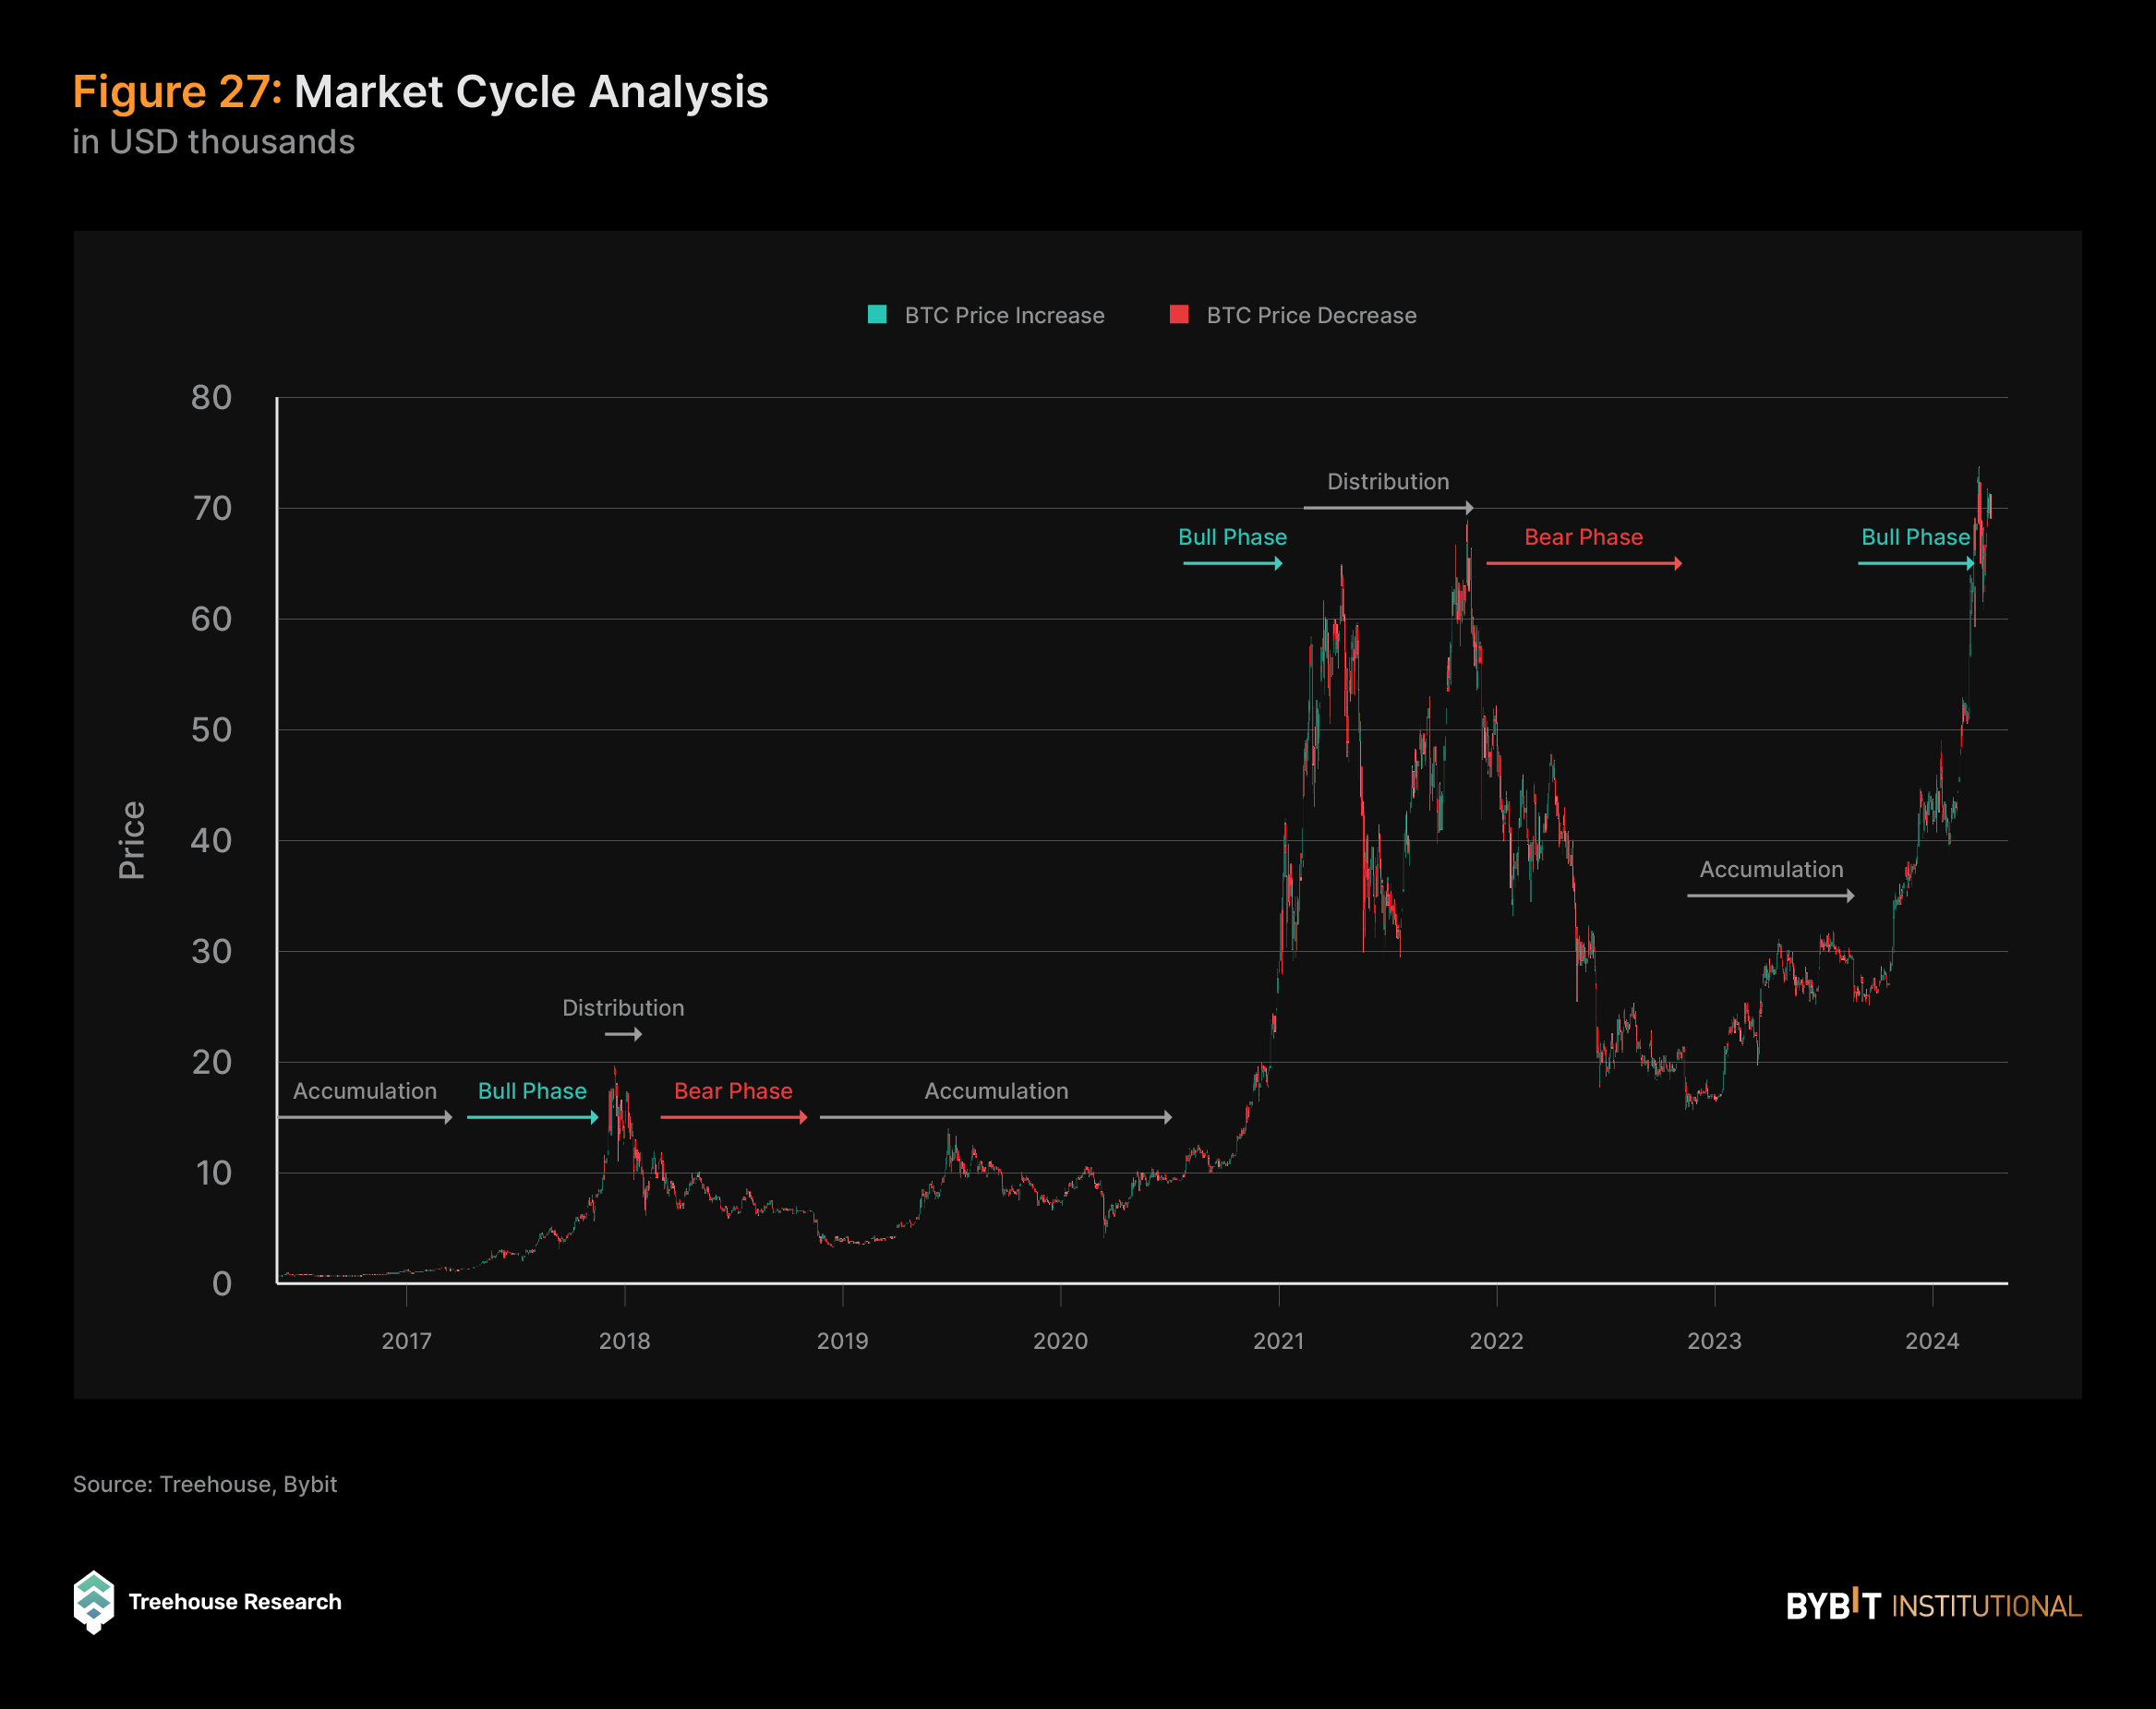
Market cycles are specific patterns that typically emerge amid the behaviors of market participants and the macroeconomic environment. Q3 2023 saw the BTC market in an accumulation phase, spanning from September until late October. During this period, trading activity slowed, with the lack of investor interest keeping prices confined within a narrow range, without any clear direction emerging.
During the first market cycle in 2017, the crypto market roared through an eight-month bull run, with Bitcoin increasing 1,400% and peaking in December before settling into an 11-month bear phase that stretched through 2018, resulting in a decline of 84% for Bitcoin.
The second cycle followed a similar pattern, with a five-month surge from October 2020 to March 2021, capitulating Bitcoin by 478%, followed by a year-long bear market ending in November 2022 with Bitcoin deteriorating by 76.3%. Notably, the large drawdown in May 2021 was largely due to China’s crackdown on crypto and Elon Musk’s tweet about the environmental impact of BTC mining.
As we are now more than 5 months into the current cycle that began in October 2023, Bitcoin has surged by 155%. Historical trends indicate a potential bull run lifespan of 6.5 months, typically followed by a bear phase lasting an average of 11.5 months. These patterns serve as valuable references for investors when analyzing opportunities within each market cycle.
As we enter into the new cycle, we’ve already witnessed a number of notable events that have led to the growth. On top of the Spot ETF approvals, we’ve also seen the emergence of the inscriptions ecosystem; the new ERC-404 token standard, which combines the characteristics of ERC-20 and ERC-721; and the launch of the Ethereum Dencun Upgrade on the mainnet. These events have attracted institutional investors and retail traders to the cryptocurrency space and contributed to the influx of liquidity.
Going forward, there are some key timelines that may influence the next phase of the market cycle, including the potential approval for Spot ETH ETF applications and the upcoming BTC halving event.
Derivatives Market Becoming Increasingly Bullish
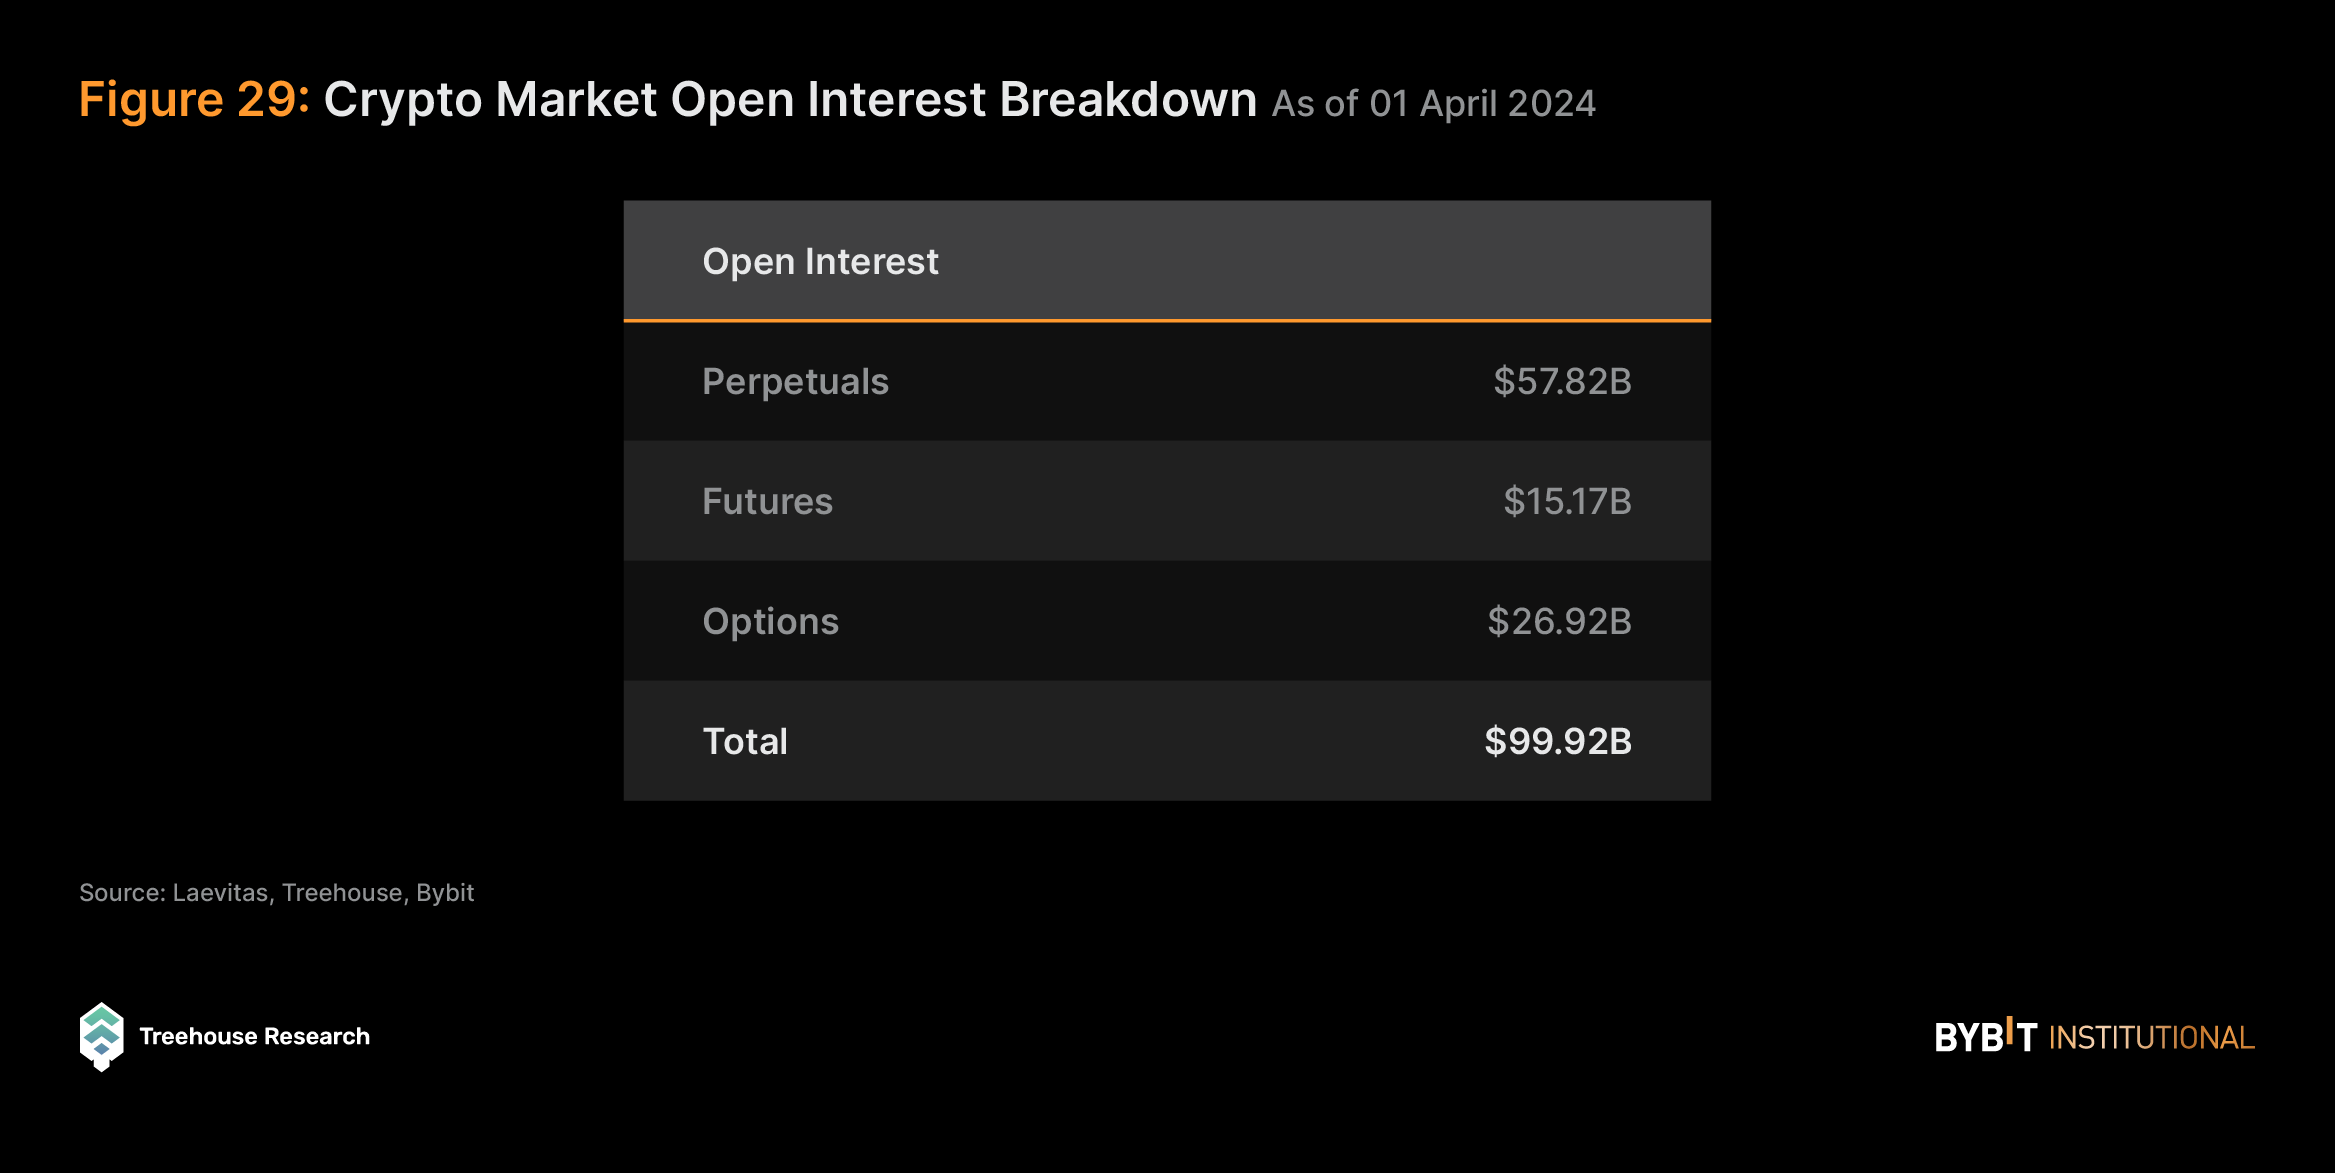
In the derivatives market, perpetual contracts continue to dominate in terms of open interest, comprising 58% of the total as of April 1, 2024. This dominance may be attributed to the positive market sentiment prevailing in the crypto space, coupled with the consequent need for leveraging among traders seeking amplified returns.
Following perpetual contracts, options have emerged as a popular choice among investors for hedging their delta exposures. Interestingly, unlike in traditional finance, futures contracts occupy only a small percentage of the derivatives market pie. This disparity can be attributed to the widespread adoption of perpetual contracts for leveraged exposure, which has overshadowed the demand for futures contracts in the crypto derivatives landscape.
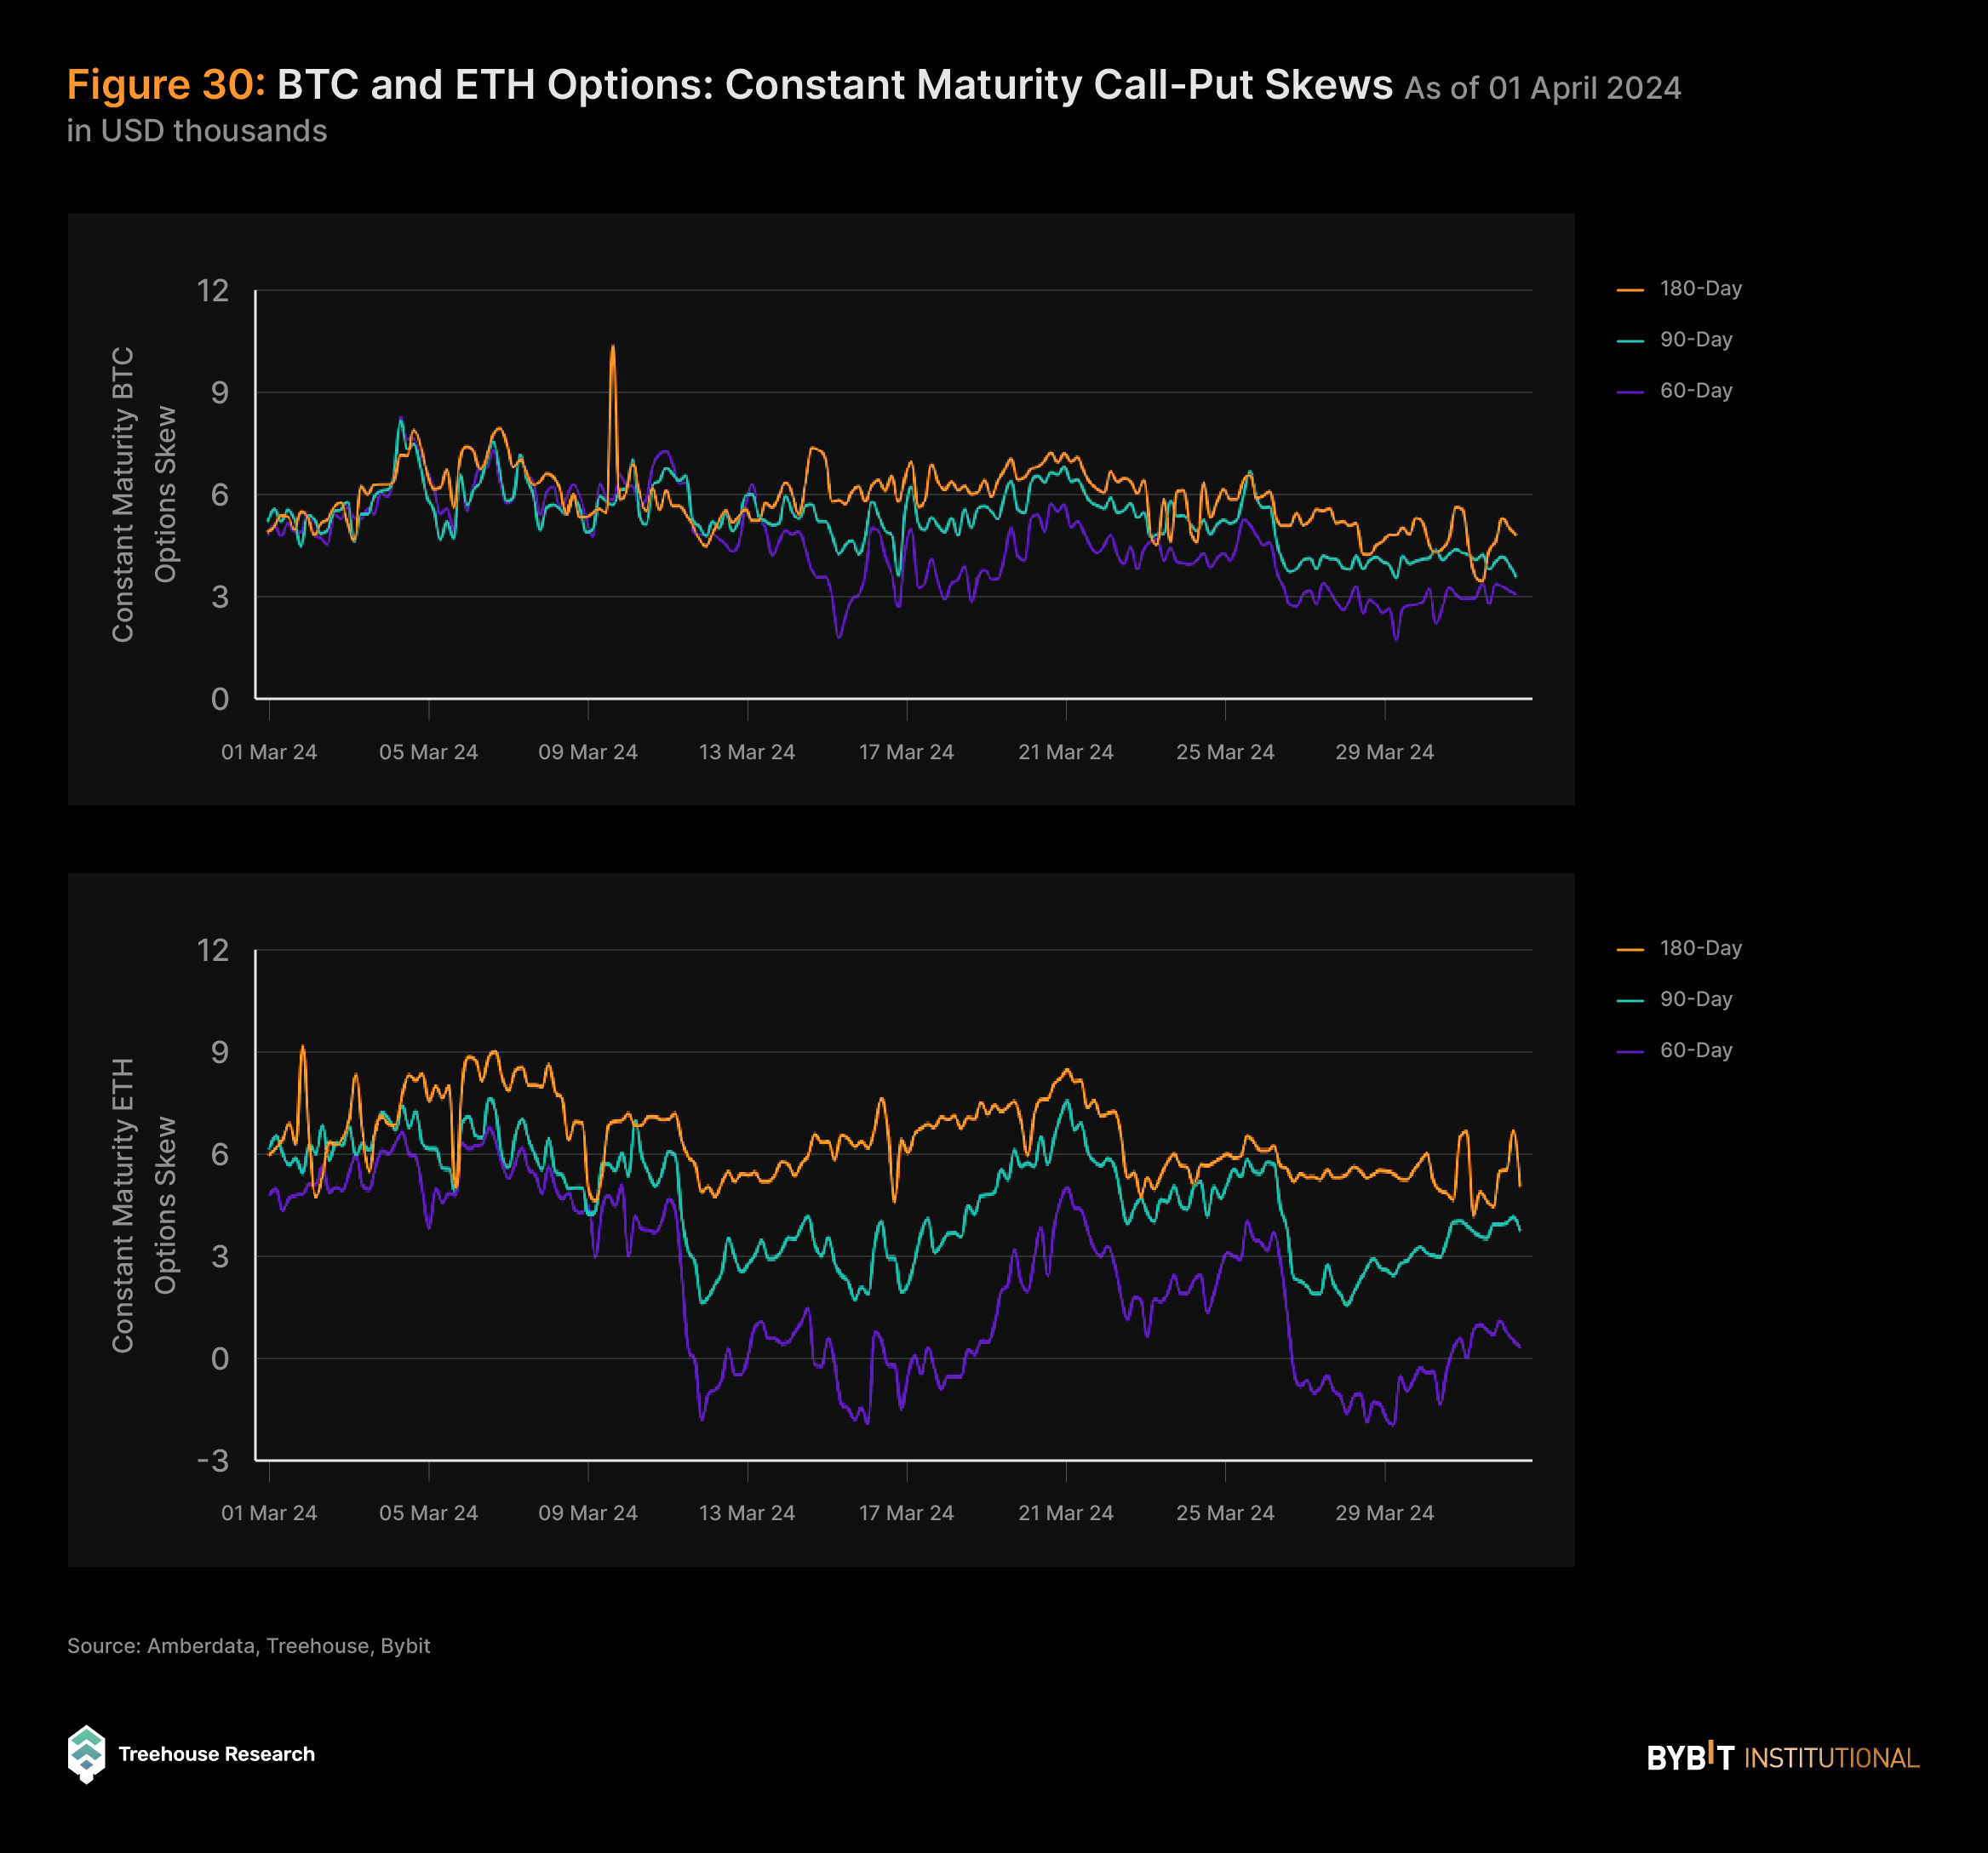
Examining the long-term call-put skews over the past 30 days reveals a notably bullish sentiment despite the relatively sideways movement in the market since March, with both BTC and ETH generally exhibiting a large call premium. This trend suggests that investors maintain a generally bullish outlook on the long-term price potential of these two crypto majors toward the end of the year.
Interestingly, the divergence in shorter and longer-term skews is more pronounced for ETH compared to BTC. This discrepancy may indicate market expectations surrounding the potential launch of Spot ETH ETFs, particularly around the mid to later part of the year. Such divergences in skews often reflect shifting investor sentiment and expectations regarding future market developments and regulatory changes within the crypto space.
Investment Behavior
BTC Holding Duration Analysis From On-Chain Metrics
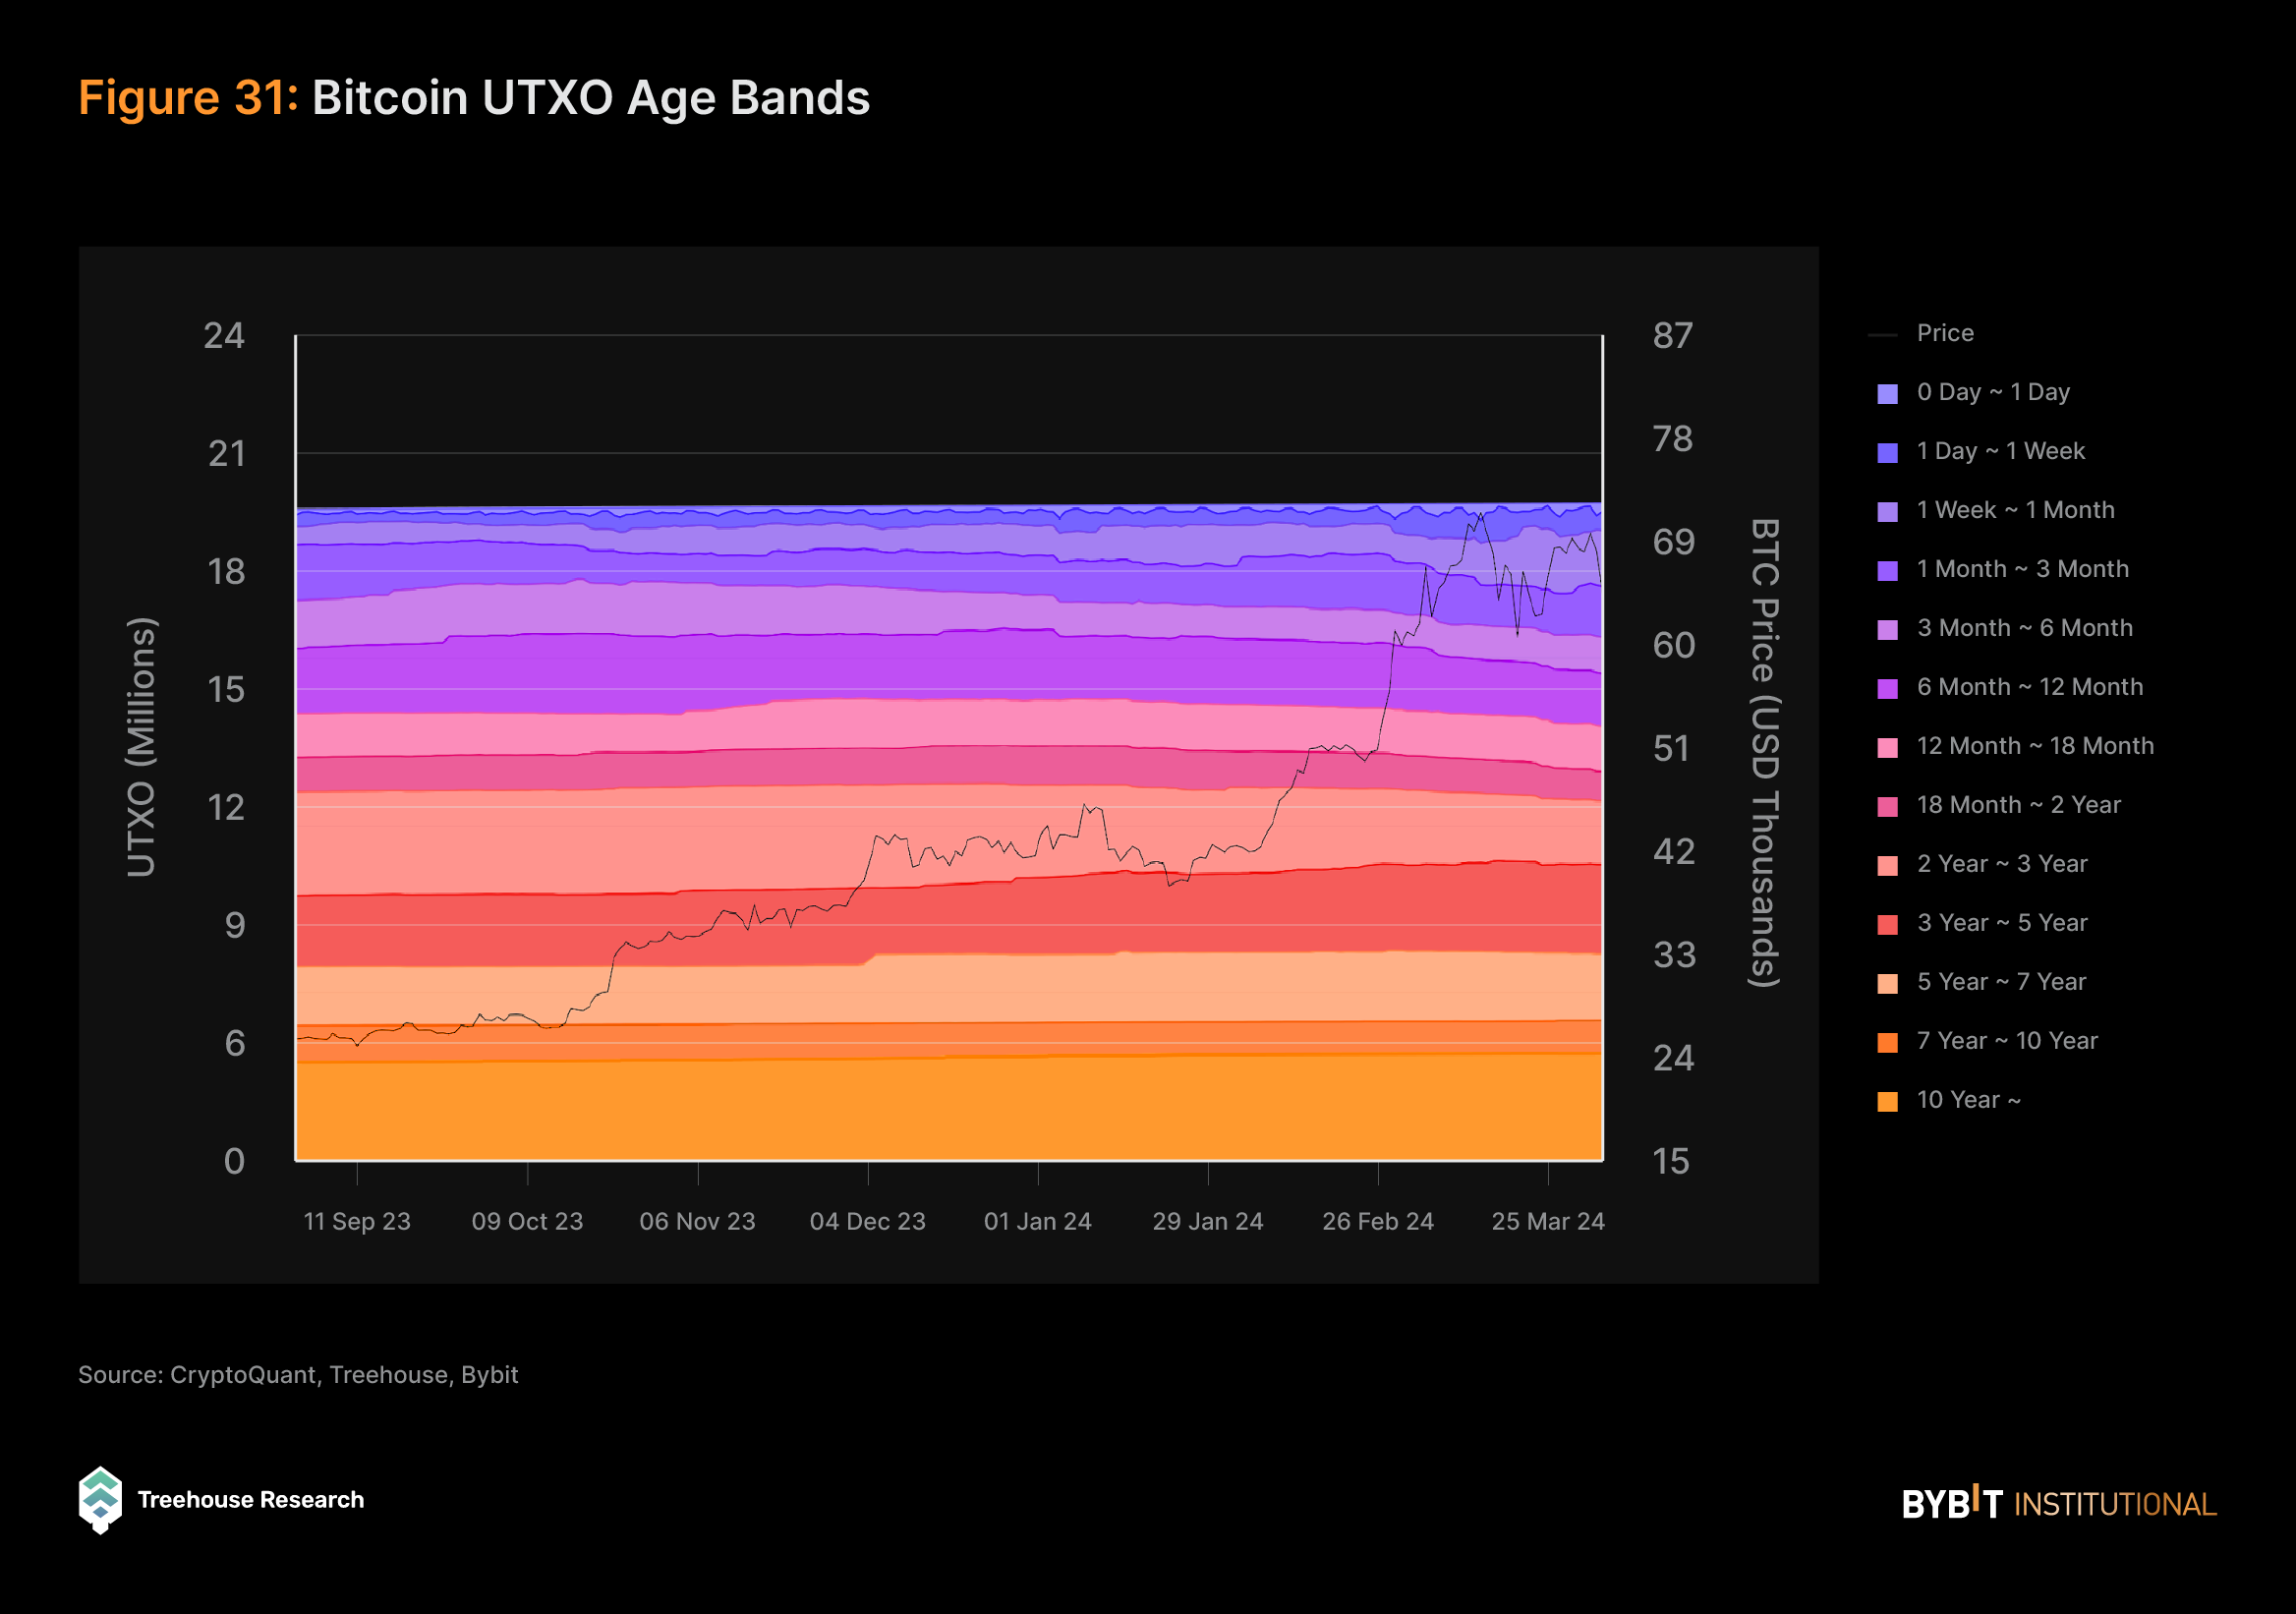
Bitcoin’s UTXO age bands determine the amount of Bitcoin UTXO since it was last used in a transaction, effectively revealing the holding period of Bitcoin by address. The colored bands show the relative fraction of Bitcoin in existence that was last transacted within the time window indicated in the legend.
Short-term age bands up to one month indicated a 139% increase, showing the growing vibrancy of the Bitcoin ecosystem in the period as transaction count increased. Conversely, addresses that have held Bitcoin over a period of more than two years have diminished by 2.4%, indicating a decrease in longer-term holding, potentially due to the potential profit-taking activities as Bitcoin reached a new all-time high. This shows that older Bitcoin tokens are being circulated into the ecosystem, resulting in newer traders as long-term age bands transition to short-term age bands. Overall, long-term addresses that haven’t transacted for two years or longer are still dominant at 54.5% of all addresses, while short-term addresses up to a month are at 12.8%.
A Shift to Shorter Investment Horizons
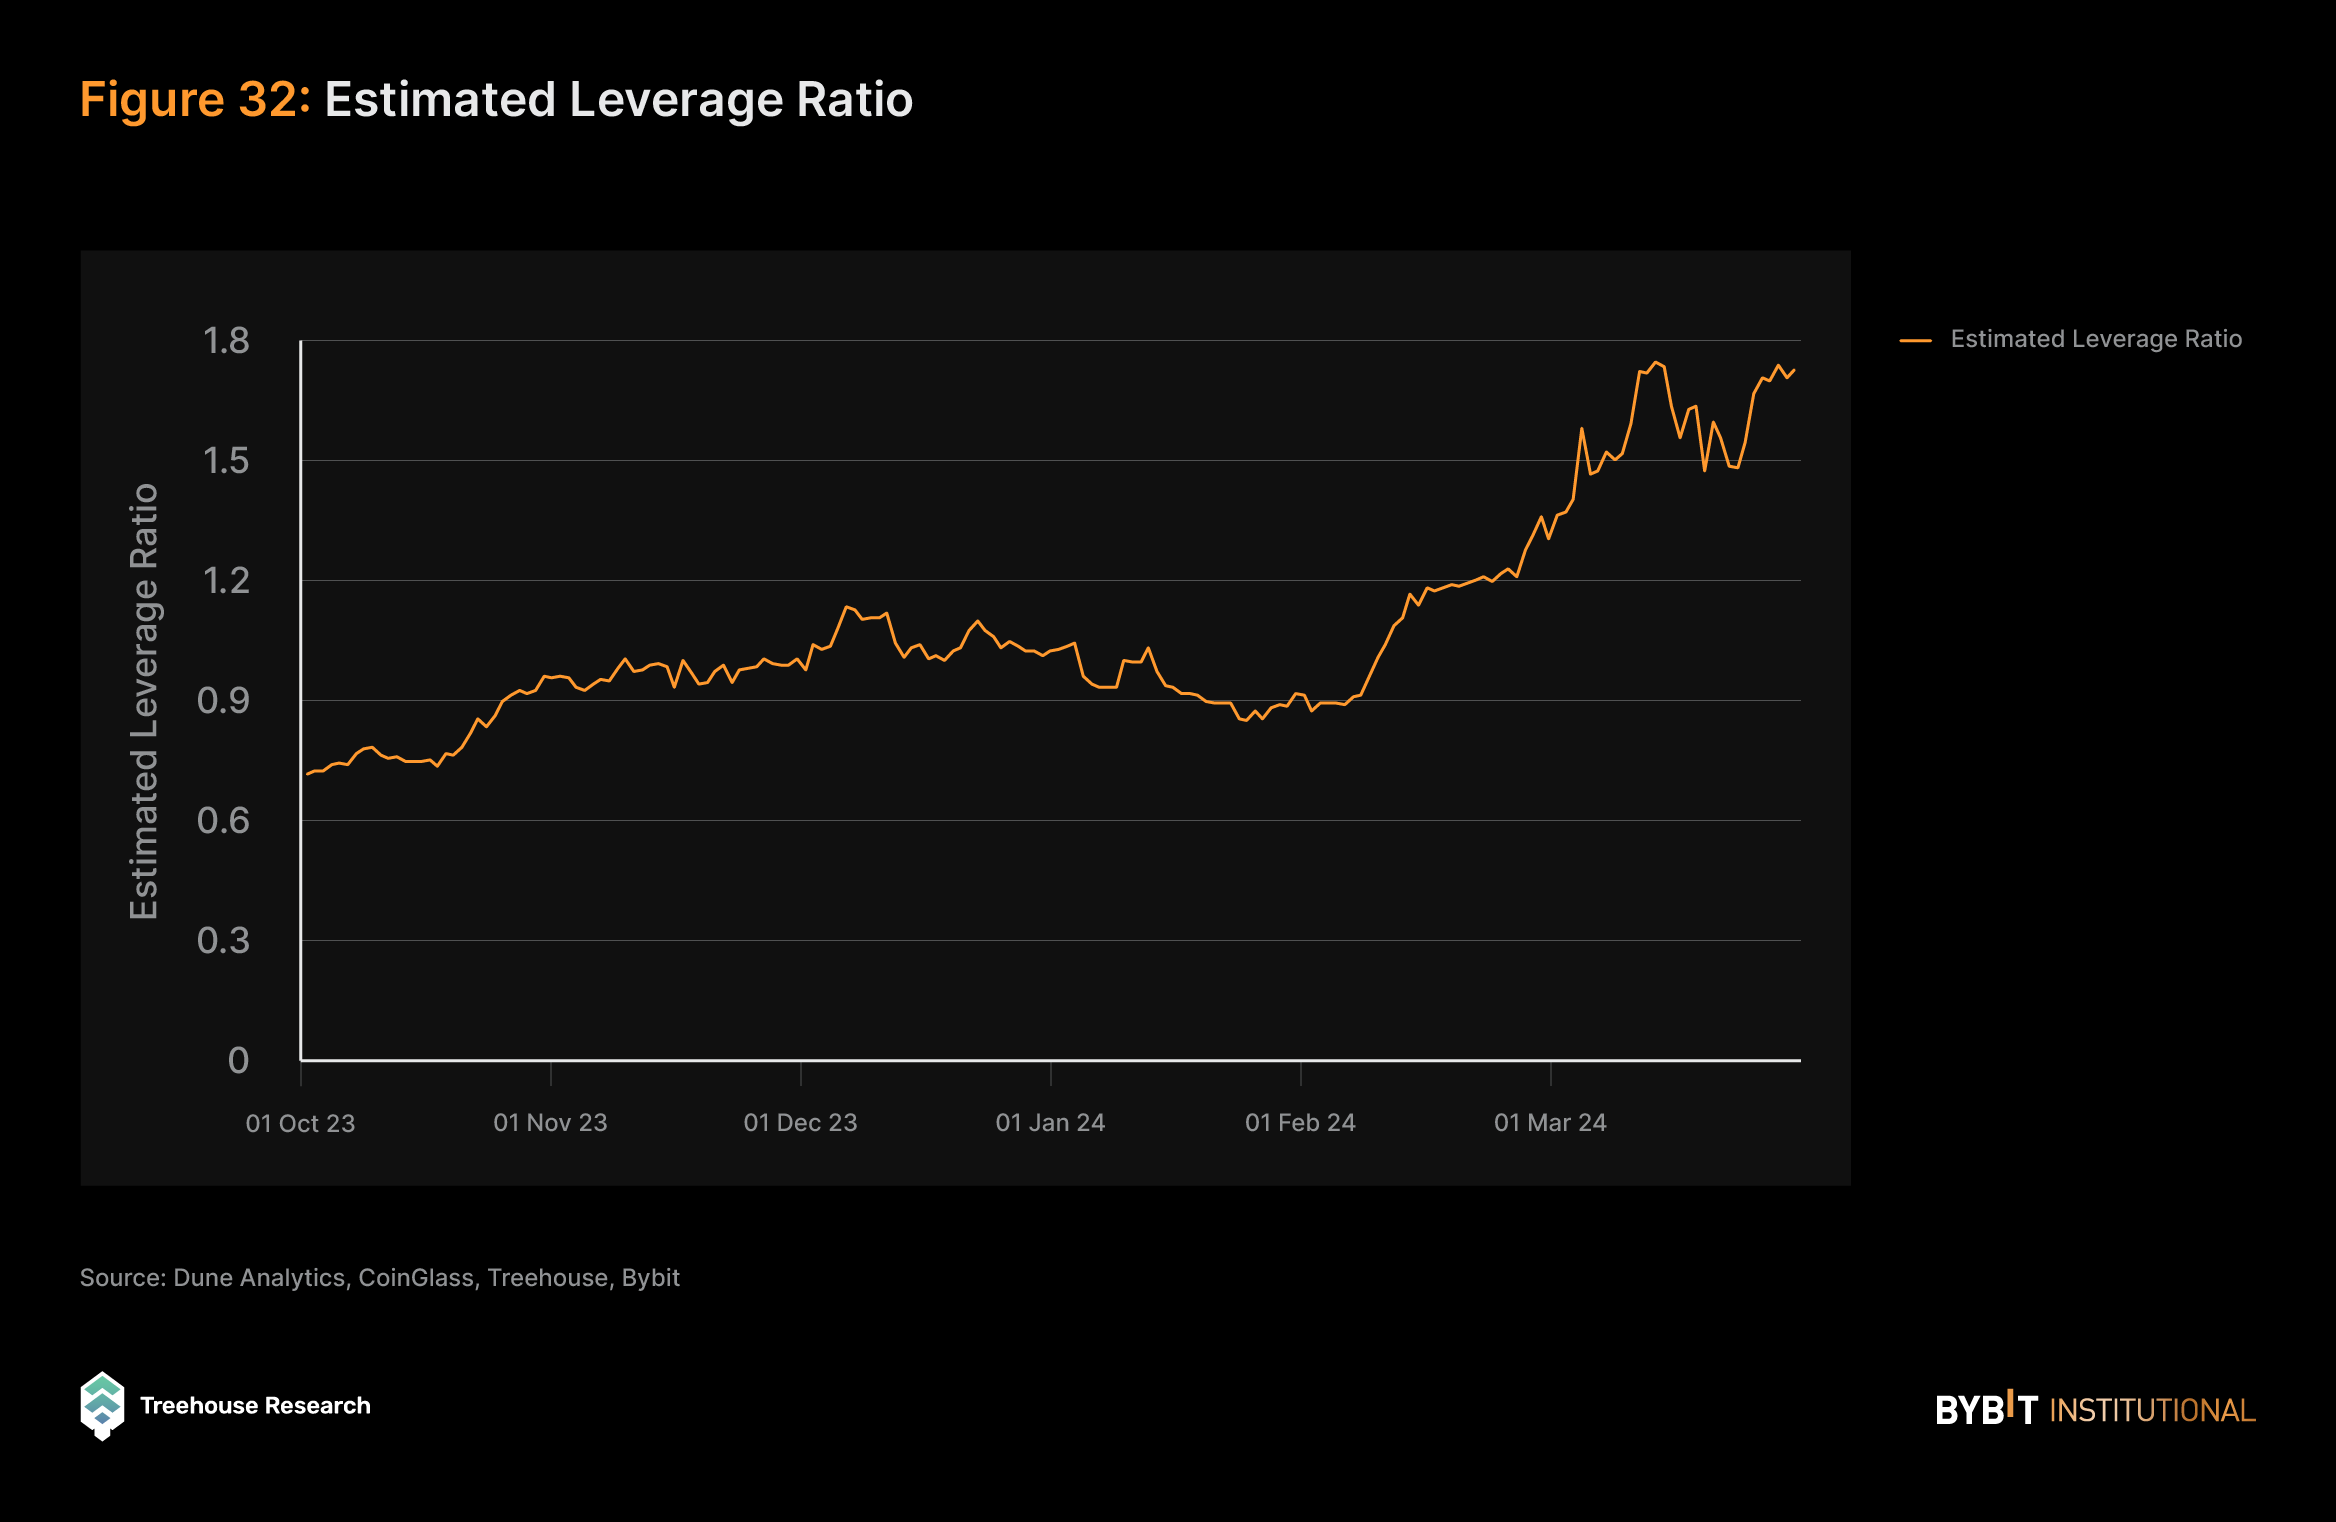
As derivative contracts, specifically perpetual futures, represent the largest share of the crypto market by trading volume and are commonly used for leveraged delta exposures, an estimated leverage ratio can be calculated by dividing the total open interest by the total assets under reserves. Calculating this metric across the top four derivatives exchanges (Binance, CME, OKX, and Bybit), we observe a significant increase over the past two quarters, reaching a high of 1.75 on March 31, 2024. This increase may indicate a growing trend among perpetual futures traders to engage in more leveraged market bets, typically associated with shorter holding periods due to the associated risks. The rising leverage suggests heightened speculative activity in the derivatives market, potentially increasing market volatility and risk exposure for participants.
Renewed Appetite Toward Challenger Chains
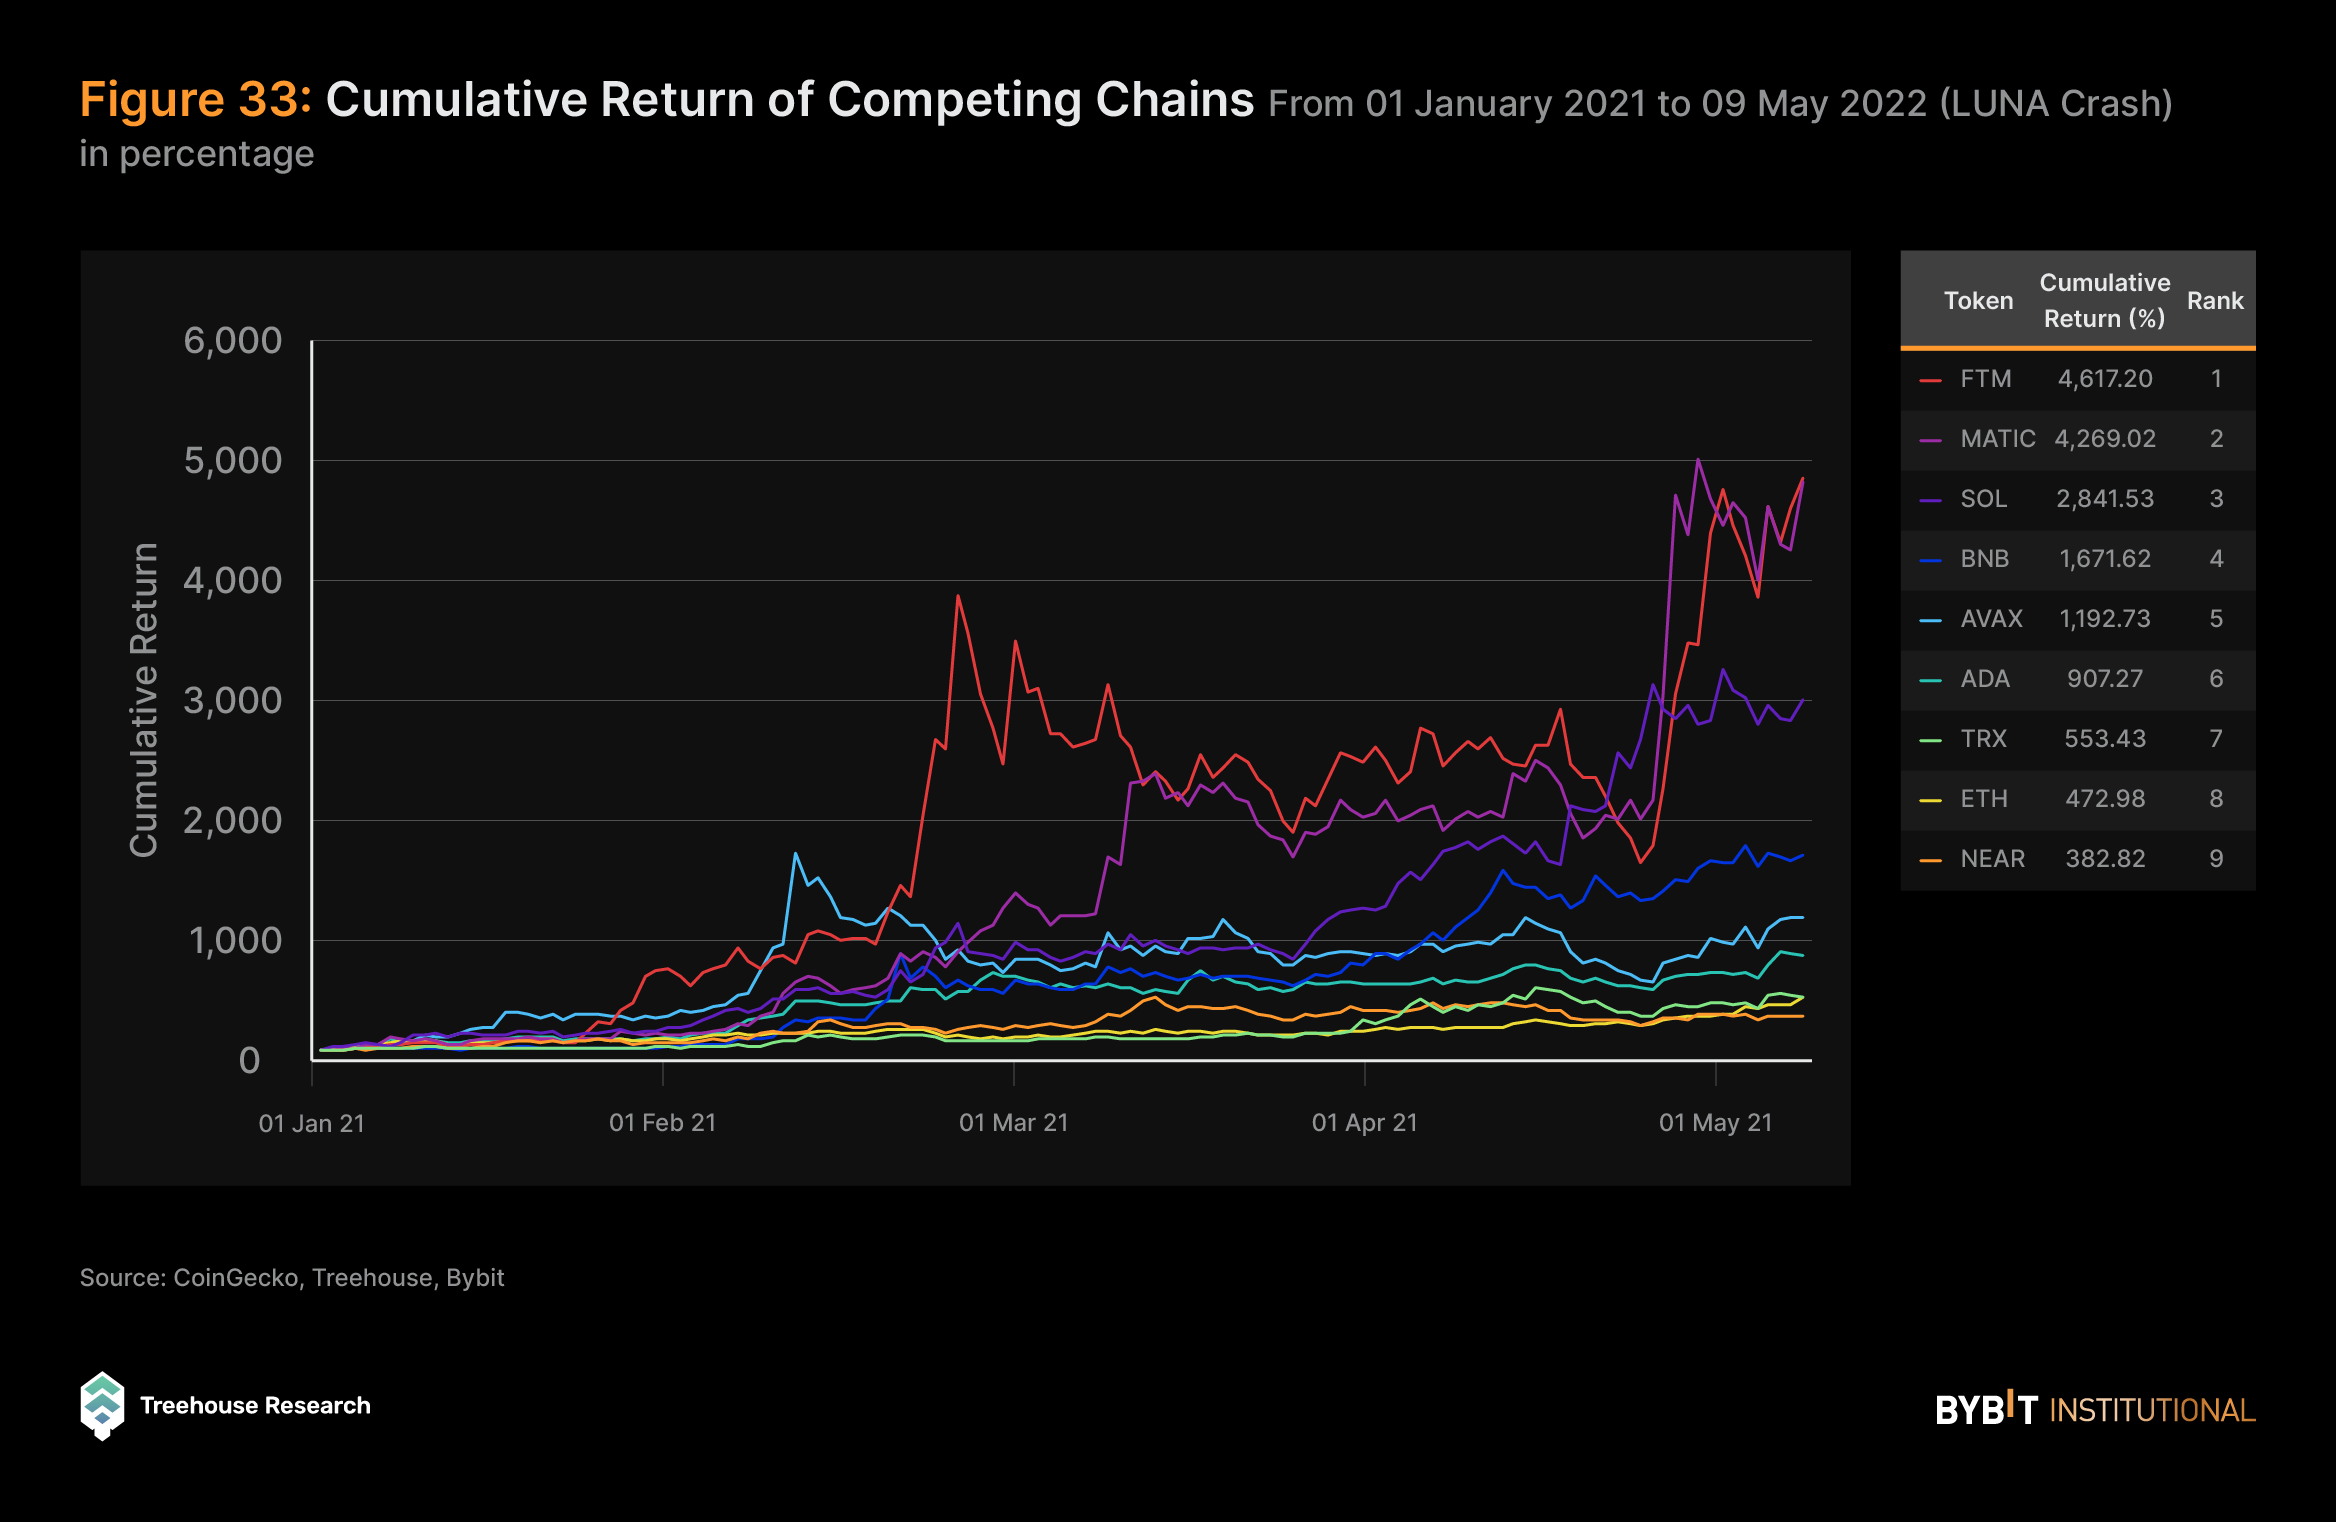
Historically, ETH has exhibited a strong correlation with BTC, which often acts as a beta to overall crypto market movements. However, during the 2021 bull market, native tokens on challenger chains such as Solana or Avalanche began to demonstrate independent price movements, diverging from the traditional correlation with ETH.
As the market enters bull cycles, investors often transition from safer assets like ETH to riskier plays, such as these challenger tokens, in pursuit of higher returns. Therefore, the performance of challenger chains during bull markets can serve as a barometer for the overall state of the market, indicating shifts in investor sentiment and risk appetite.
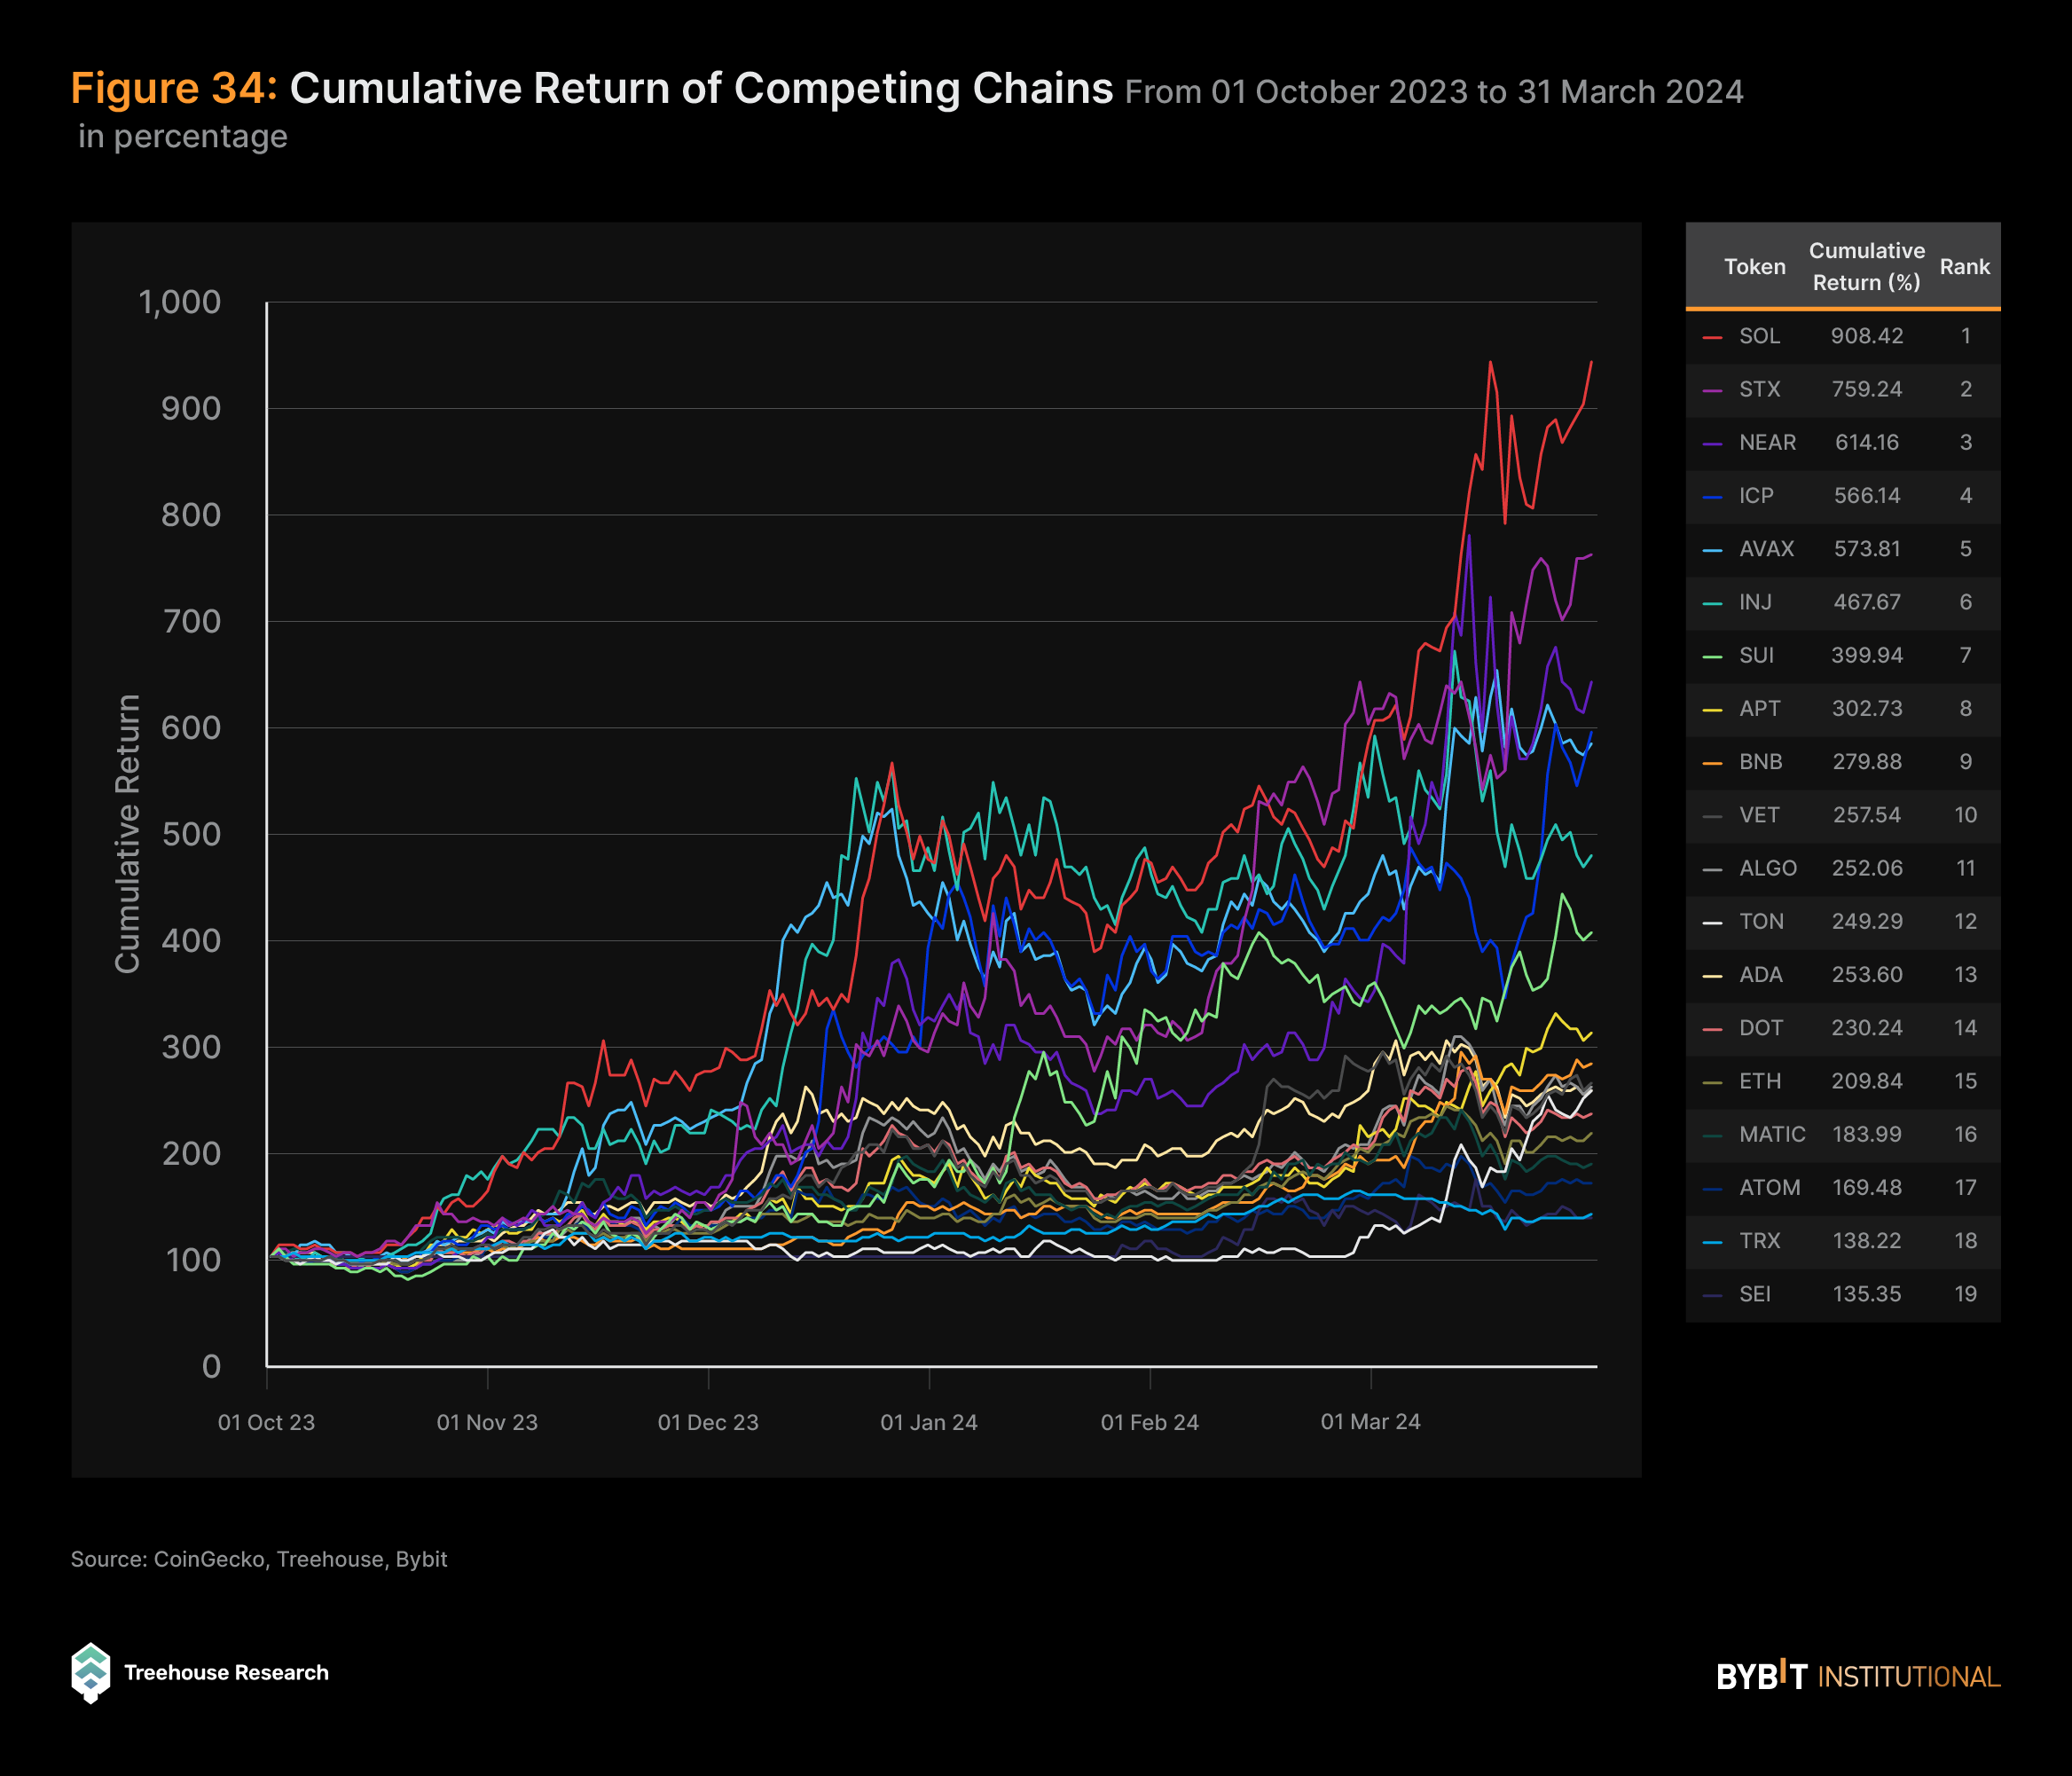
Since the beginning of Q4 2023, we’ve also observed the same notable trend that’s reminiscent of the 2021 DeFi Summer. During this period, native tokens of challenger chains have experienced significant outperformance as compared to ETH, aligning with the investment behavior outlined above.
Notably, SOL emerged as the top performer among these challenger tokens, continuing the trend observed in 2021 as the biggest challenger chain by TVL and transaction volume. This indicates that we may be at the early stages of a new bull market cycle, as investors are willing to bet on challenger chains to potentially dethrone Ethereum’s dominant status.
Increasing Interest in the Funding of AI and Bitcoin Ecosystem Projects
Amid the crypto market’s resurgence, there’s been a notable uptick in venture capital (VC) funding, signaling renewed investor confidence and interest in the sector. In Q4 2023, VC deal counts surged by 21% to reach 174, while the disclosed funding amount increased by 29% to a total of $1.42B. In Q1 2024, there were a total of 243 deals with disclosed funding amounting to $1.94B another 36% increase building off Q4 2023.
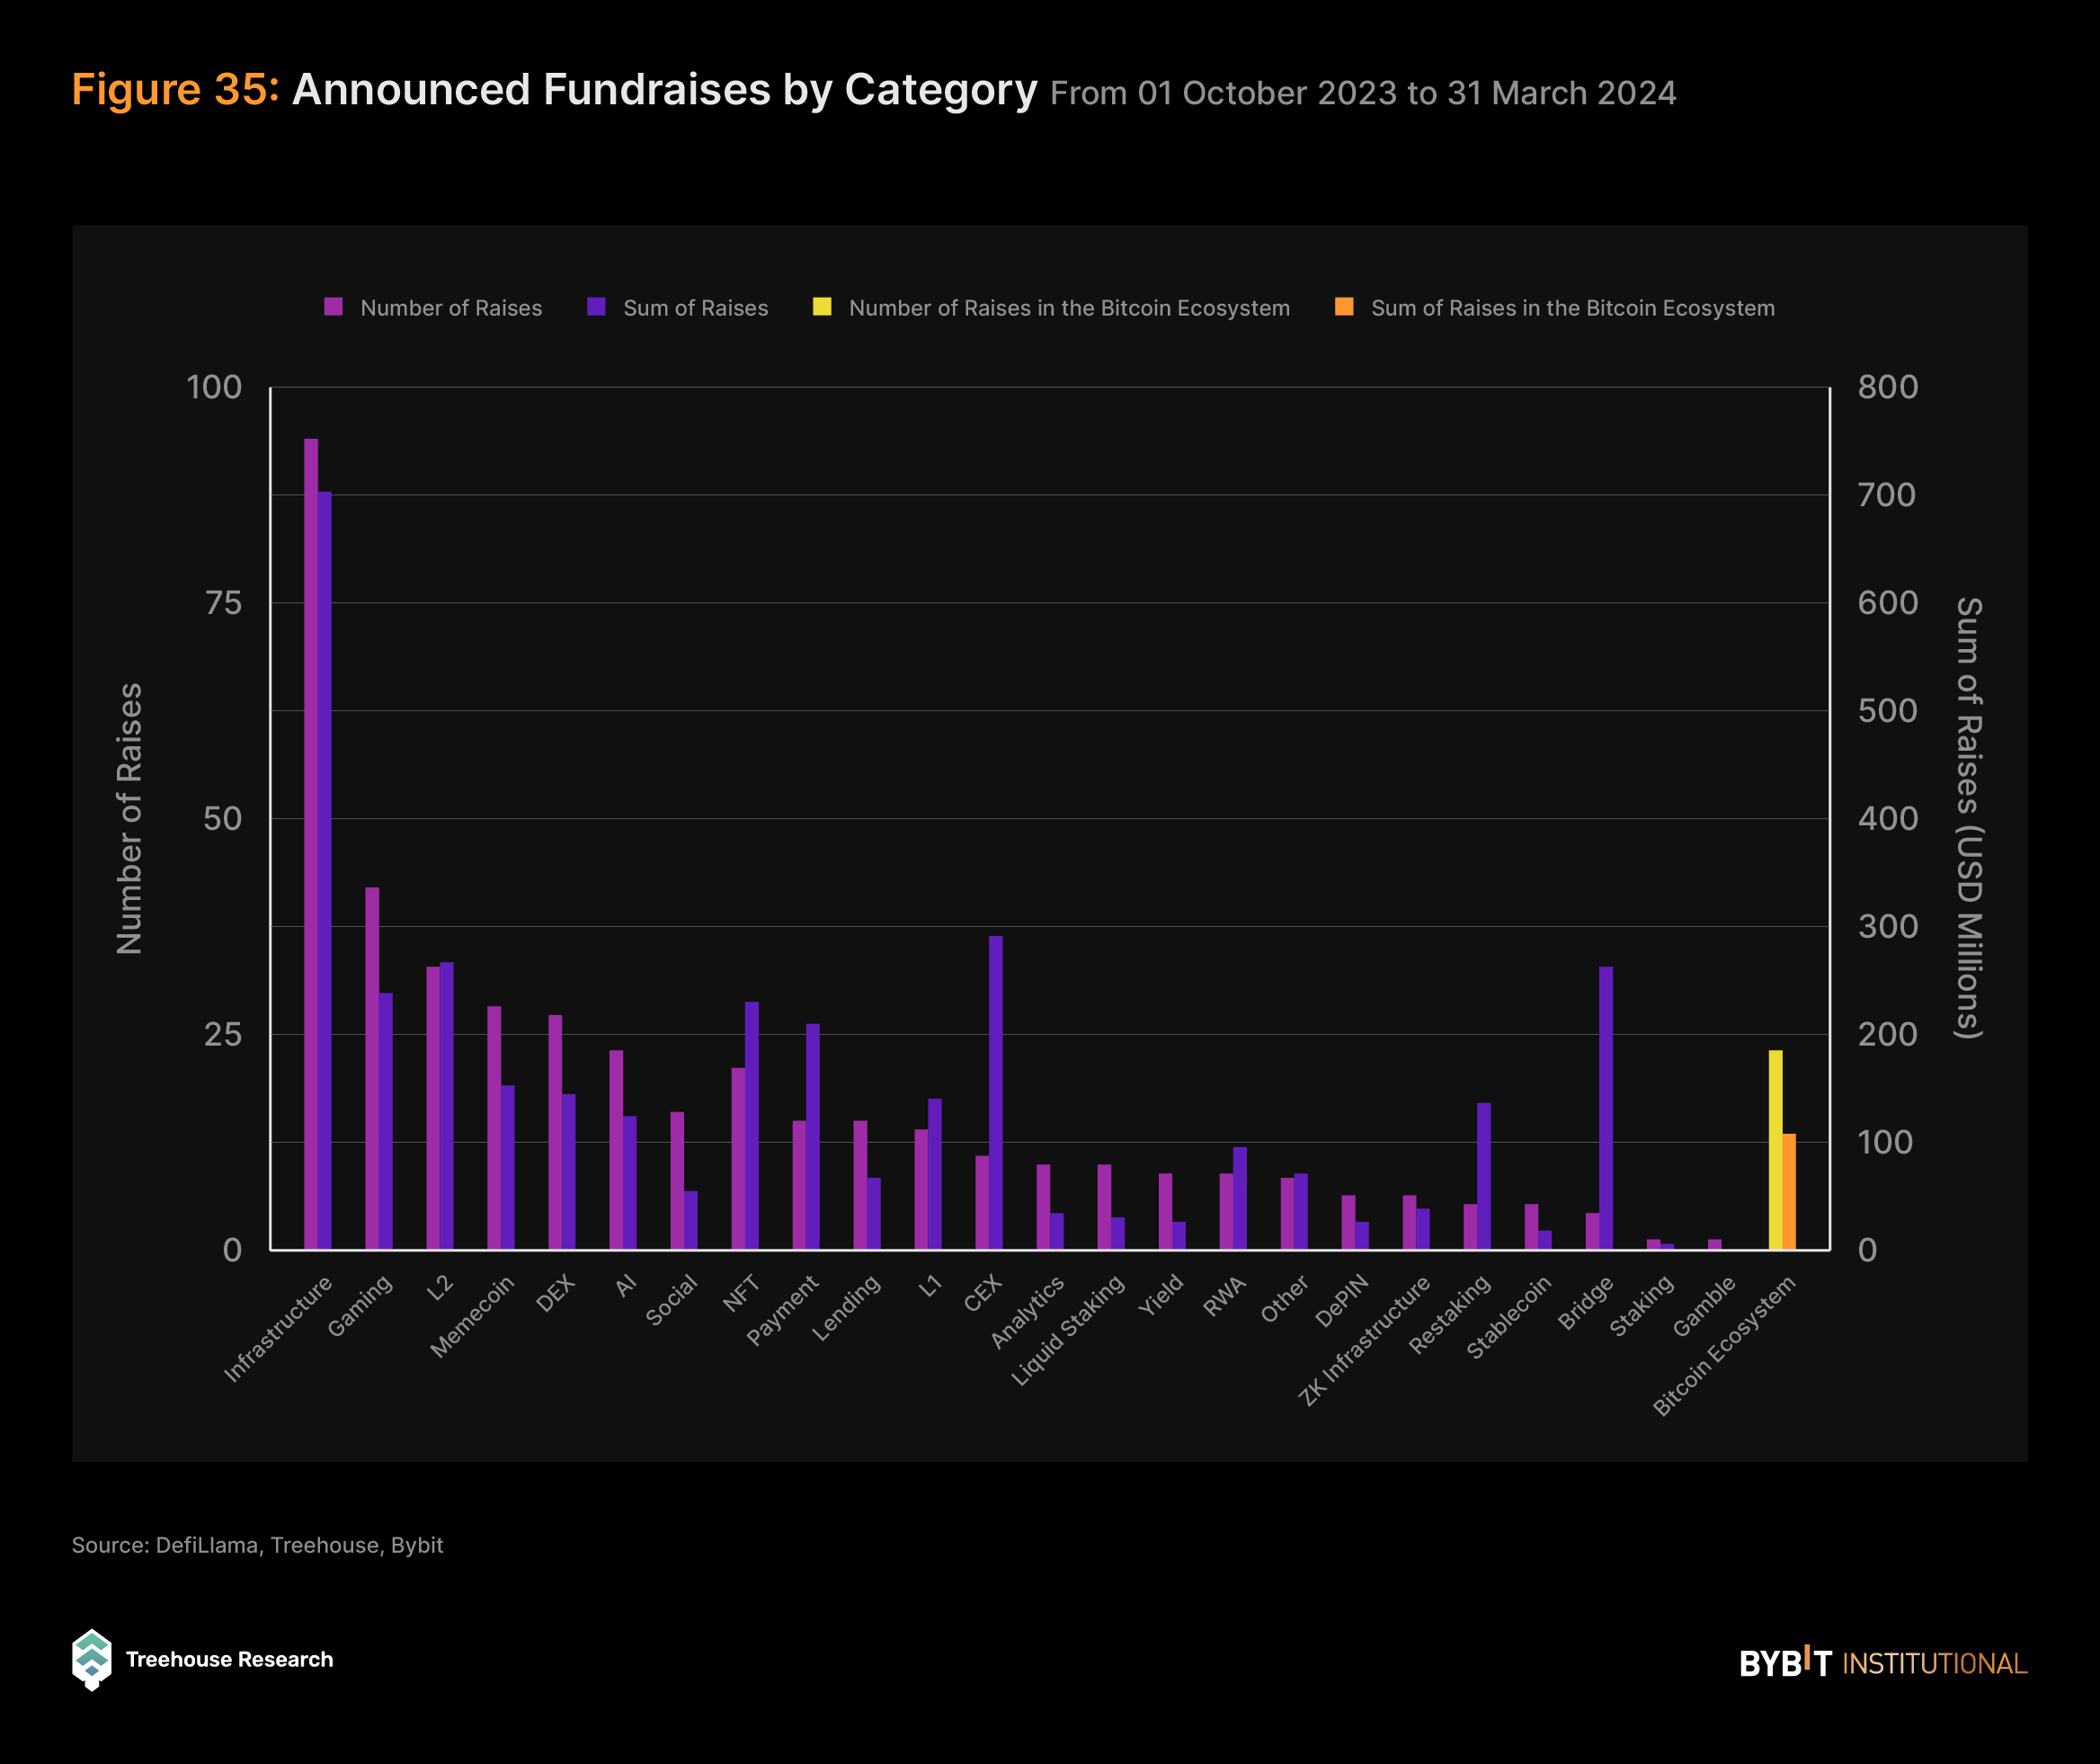
Infrastructure projects continue to dominate the VC investment landscape, attracting significant capital from investors seeking to support foundational elements of the blockchain ecosystem. These projects span a wide range of sectors, from hardware wallets to blockchain data providers, offering essential solutions to address various industry challenges and facilitate innovation.
Moreover, emerging trends in VC funding highlight the diversification of investment interests within the crypto space. While traditional sectors such as gaming, Layer 1 and Layer 2 protocols, and DEXs remain popular targets for investment, two sub-sectors have recently garnered increased attention: artificial intelligence (AI) projects that leverage AI technologies within the blockchain space, and initiatives focused on building atop the Bitcoin blockchain ecosystem.
Artificial Intelligence
The recent surge in NVIDIA’s valuation underscores the rapid expansion and growing impact of AI across diverse sectors, as companies leverage NVIDIA’s GPU chips to train machine learning models. With AI increasingly maturing and integrating into various facets of everyday life and business functions, its growth trajectory appears promising and poised for further expansion.
This burgeoning growth of AI as a standalone sector holds significant implications for AI-focused cryptocurrencies and blockchain projects. The integration of AI and blockchain technology enhances the capabilities and efficiencies of both fields. Given the momentum behind AI’s growth, as exemplified by NVIDIA’s performance, it’s reasonable to anticipate that AI-centric cryptocurrencies will experience similar upward trajectories.
The increasing interest in AI isn’t limited to primary markets — hence, the rise of projects like Bittensor (TAO) and The Render Network® (RNDR).
Bittensor is pioneering a decentralized network that incentivizes the sharing of machine learning models. In utilizing a unique consensus mechanism, it allows nodes to earn TAO tokens by contributing to the development and training of AI models. On the other hand, Render focuses on the decentralized rendering of 3D graphics through the power of blockchain. Leveraging unused GPU processing power of network participants, it facilitates the production of complex graphics and animations integral to AI, virtual reality, and video production.
The combination of AI and blockchain opens up myriad possibilities, driving investor interest in projects that can harness the potential of both categories. These AI-focused cryptocurrencies represent a convergence of blockchain and AI technology, with potential high-growth opportunities. These technologies’ rapidly evolving natures, combined with regulatory uncertainties, present both opportunities and risks. As the AI sector continues to expand and evolve, the synergy between these two areas of technological advancement is expected to fuel further innovation and growth in the cryptocurrency space.
Bitcoin Ecosystem
Interest in the Bitcoin ecosystem can largely be traced to the emergence of Ordinal inscriptions in early 2023. Inscriptions enable individual satoshis (the smallest unit of Bitcoin) to be tracked and inscribed with arbitrary content, such as text and images. The concept of inscriptions gave rise to BRC-20, an experimental token standard facilitating the creation, minting, and transfer of fungible tokens on the Bitcoin blockchain. Leveraging the Ordinals protocol, this standard inscribes JSON-based data onto individual “sats,” thereby generating fungible tokens on them.
The inception of the BRC-20 token standard, inscriptions, and the BTC Spot ETF approvals have had a significant impact on Bitcoin’s ecosystem through increased block demand, mempool growth, developer activity, and transaction fees incurred. Consequently, there’s been increased involvement in existing projects, as well as the emergence of innovative DApps, indicating the unrealized potential within the Bitcoin ecosystem. Various verticals, including tooling, launchpads, and analytics platforms, have also seen notable developments.
bitSmiley, Liquidium, and Portal are examples of DeFi projects on the Bitcoin network that offer stablecoin, lending, derivatives, and cross-chain capabilities across multiple chains, reducing friction in navigating the Bitcoin network, facilitating transactions, and providing a multitude of options to capitalize on assets.
For institutional investors, the Bitcoin ecosystem remains a crucial sector to monitor, given that its fundamentals are closely linked to BTC’s performance. Ongoing innovation and rising developer activity within the ecosystem are streamlining access for investors, offering a growing pool of resources comparable to those available in Ethereum virtual machine (EVM) ecosystems.
This trend toward greater accessibility and resource parity with EVM counterparts is expected to drive increased user adoption and liquidity within the Bitcoin ecosystem, enhancing its appeal to institutional investors.
Future Outlook
Long-Term ETF Impacts
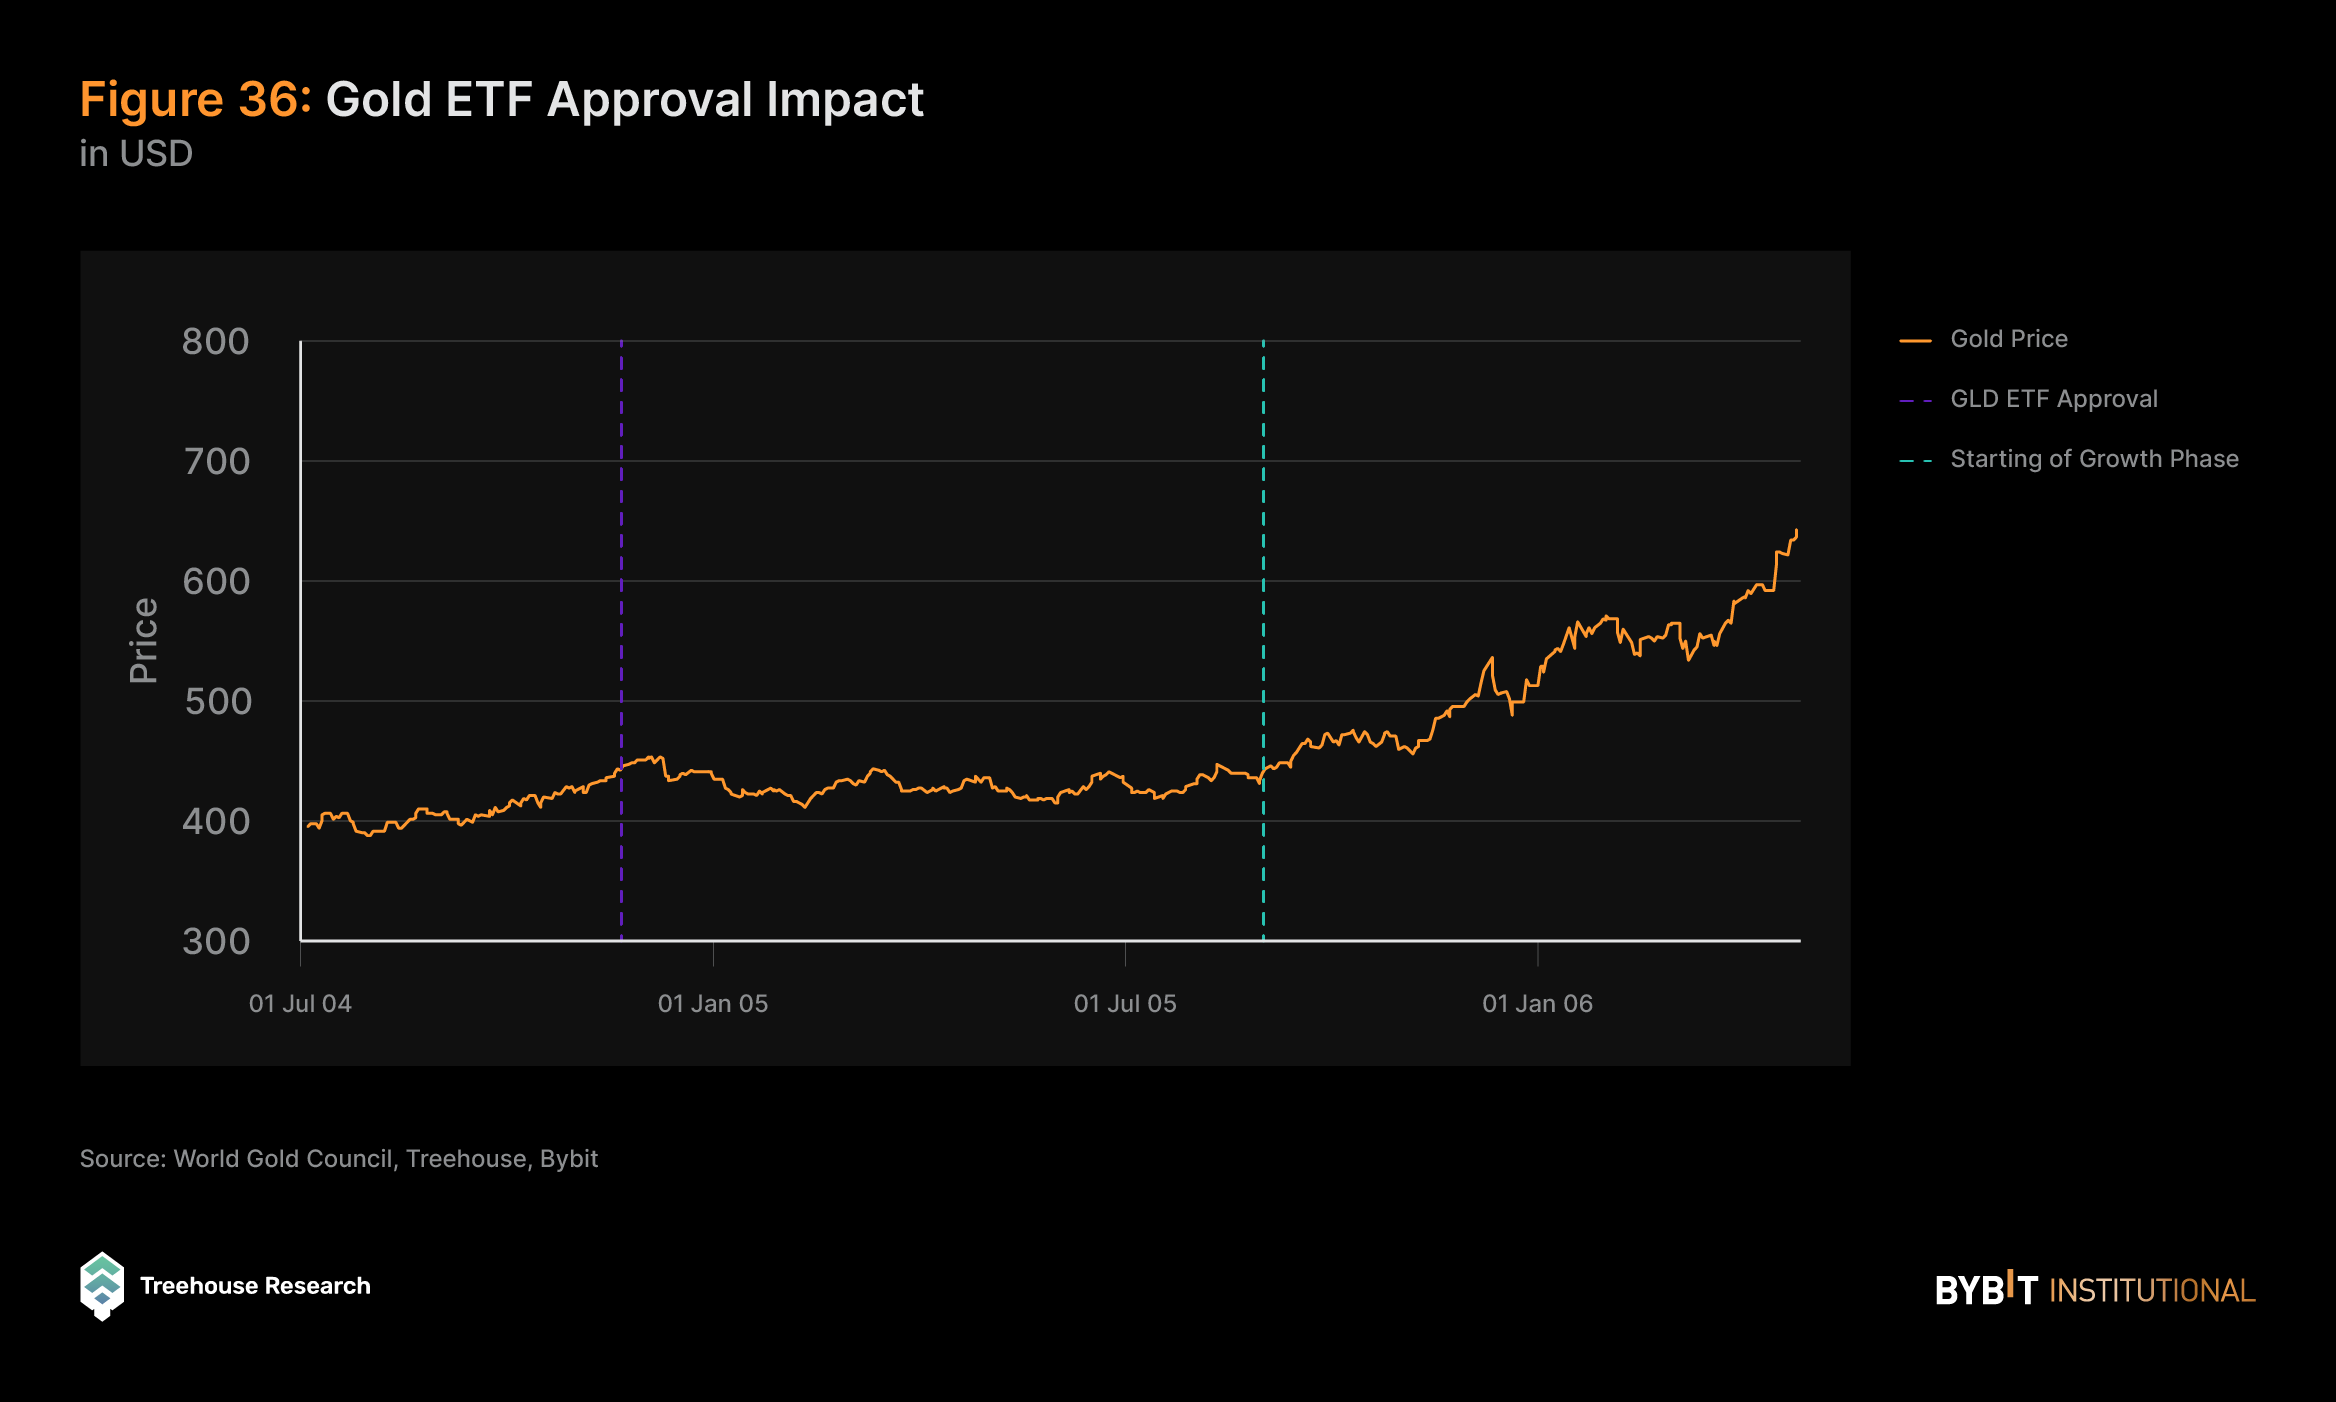
The historical parallel of the inaugural approval of a gold ETF in November 2004 offers valuable insights into the potential long-term impact of BTC Spot ETF approvals. Instead of immediate rallies, the gold market experienced a period of stabilization following the ETF approval. It took nearly a year, until September 2005, for a significant uptick in price.
This suggests that the market needed time to assimilate the introduction of the new investment avenue and understand its broader implications. Similarly, the approval of BTC Spot ETFs may not lead to immediate price surges, but could pave the way for exponentially increased adoption and appreciation over time as the market adjusts to this new investment opportunity, and as these ETFs provide BTC exposure to a wider, more regulated investor base.
Just as with gold ETFs, Bitcoin Spot ETFs pave the way for a more diverse and expansive investment portfolio, signaling a pivot toward mainstream financial acceptance. The gradual but steady embrace of BTC, catalyzed by the Bitcoin Spot ETF, may well lead to a trajectory of growth that’s less about immediate spikes and more about sustained progress, much like the ascension of gold prices following their own ETF milestone.
The Fourth Halving
As we look ahead to the next significant event in the Bitcoin ecosystem, the upcoming halving event (projected for April 20, 2024) looms as a pivotal milestone to closely monitor. This reduction in mining rewards, occurring approximately every four years, holds historical significance within the cryptocurrency community, with previous halvings often correlating with notable price surges and shaping the long-term trajectory of Bitcoin’s value.
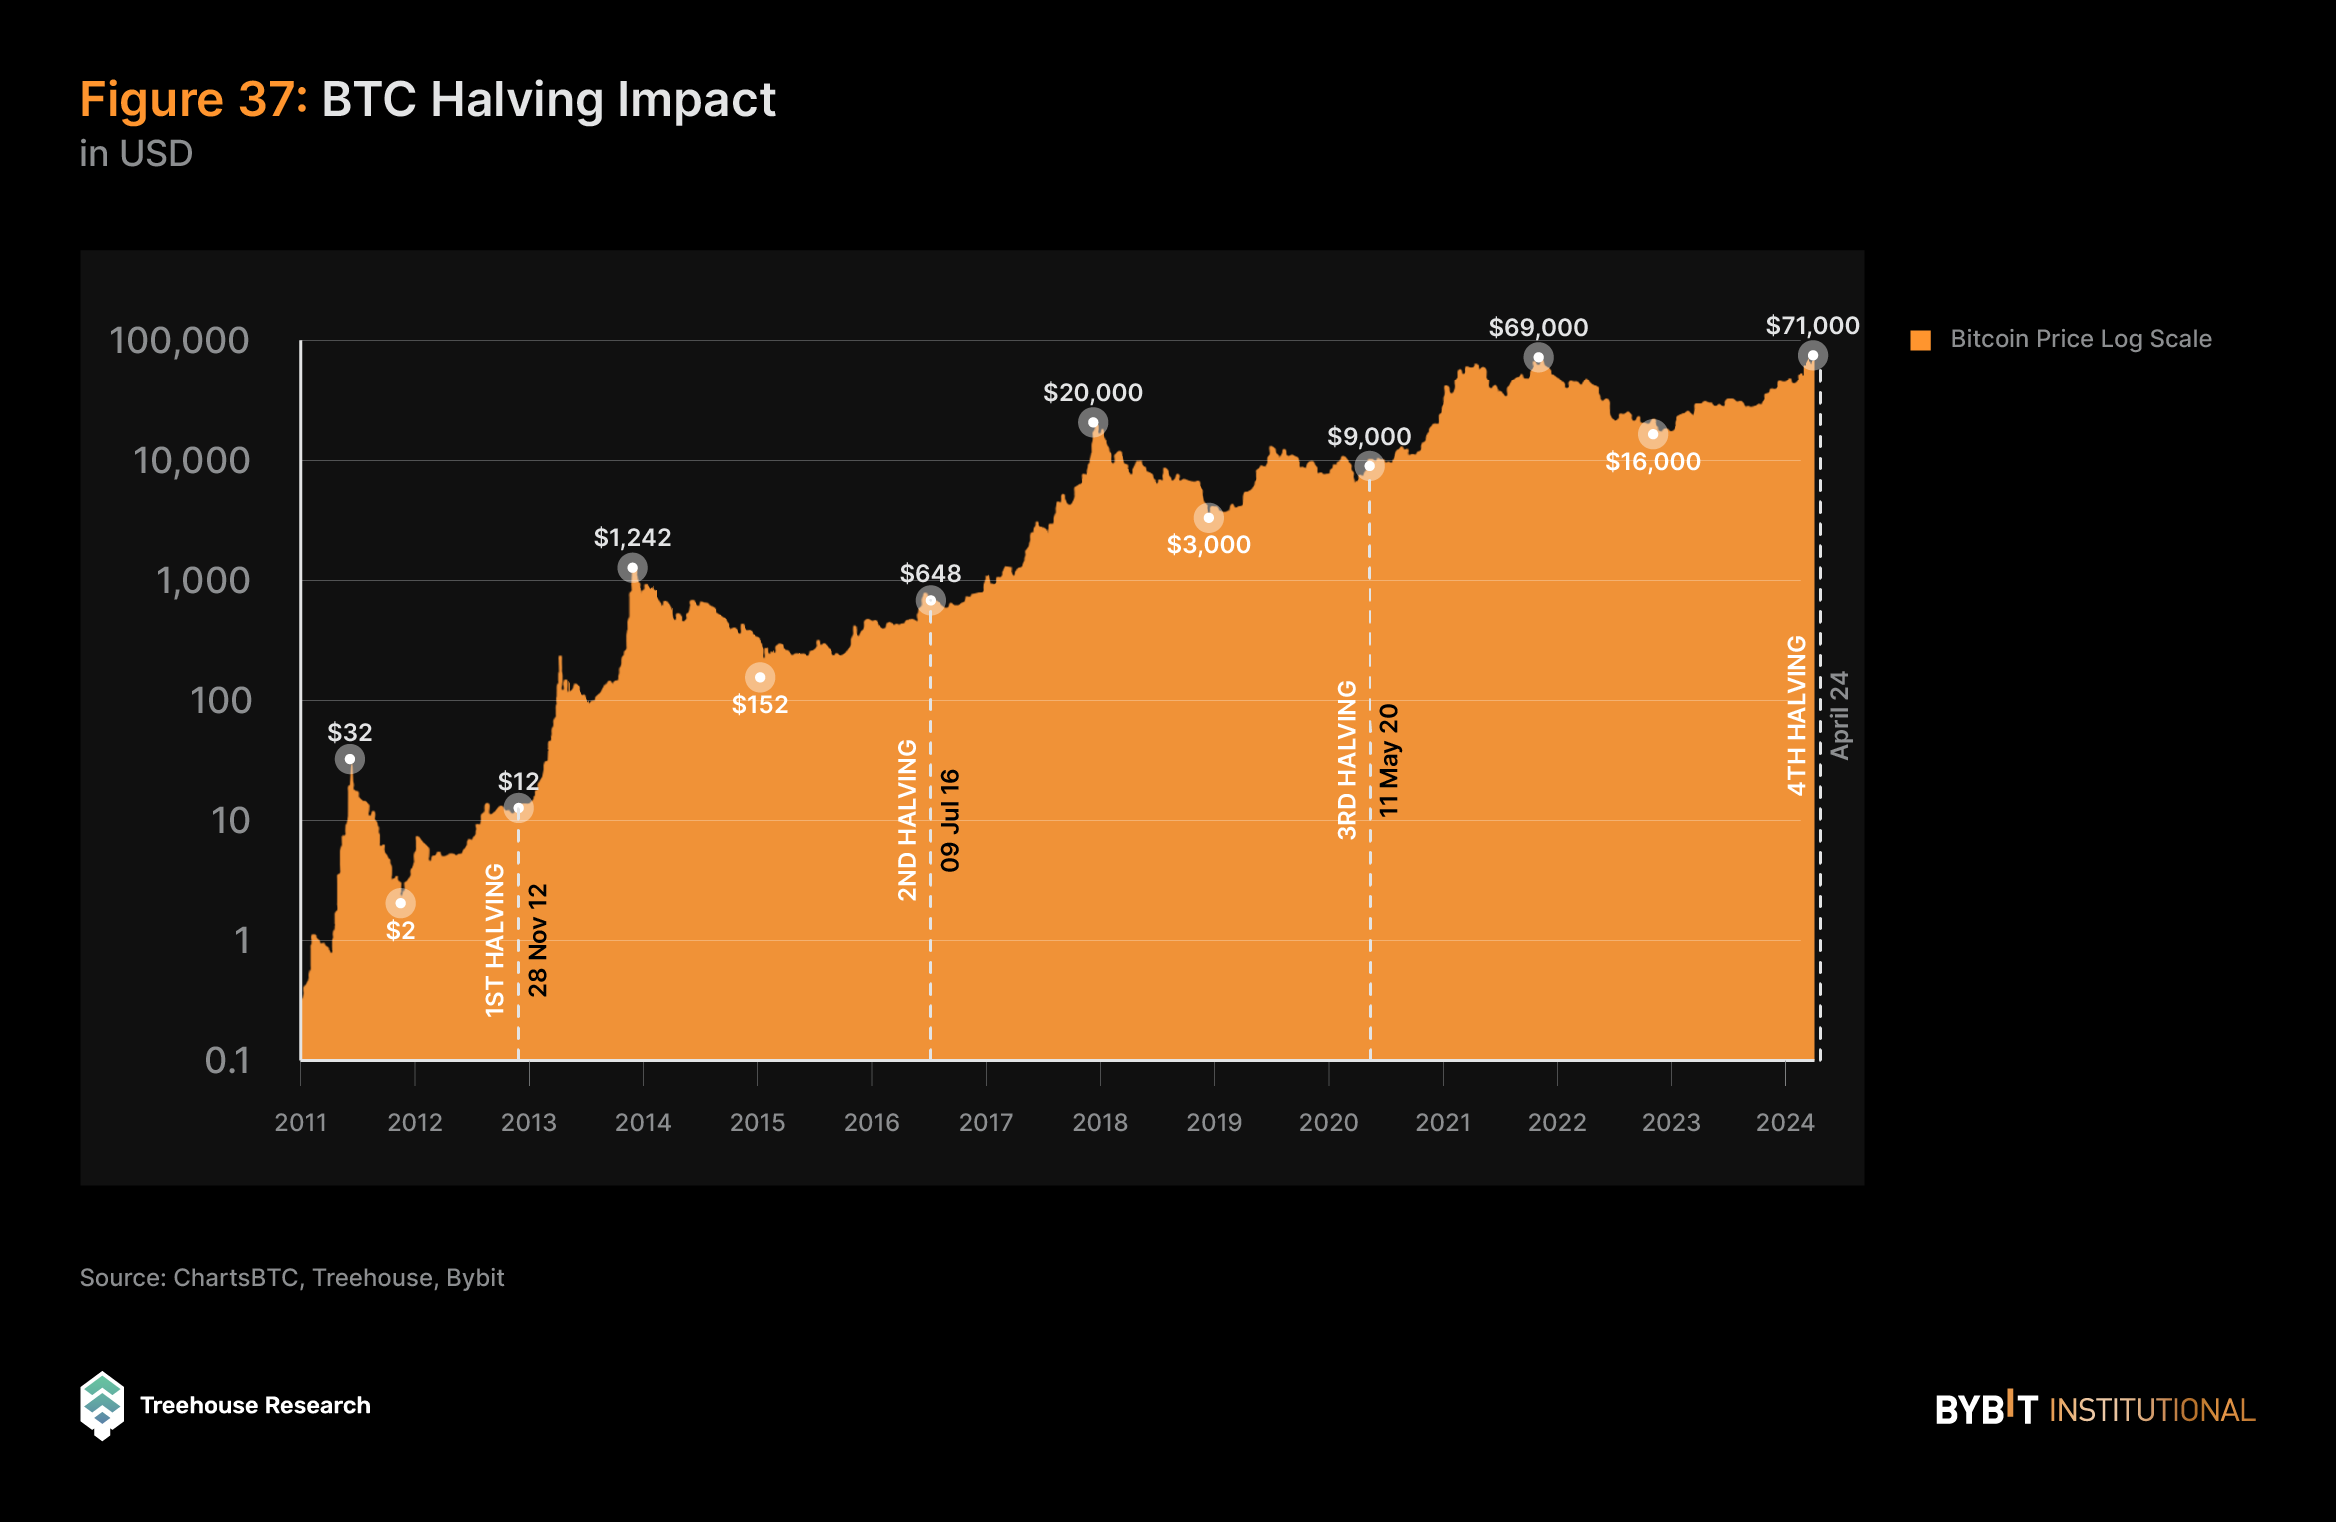
After the first Bitcoin halving on November 28, 2012, Bitcoin closed at $12.20. The first significant all-time high (ATH) formed toward the end of 2013, with BTC’s price exploding above $1K, representing an increase of over 8,000% within the first year after the halving. During the second halving on July 9, 2016, Bitcoin was at a low of $648 before sharply increasing to the next ATH of $20K at the end of 2017, an increase of over 3,000%.
As a result of the third halving on May 11, 2020, Bitcoin’s value of $9K increased over 600% to another ATH of $69K in November 2021. Now, Bitcoin’s price has been on the rise since early 2023 in anticipation of the halving that’s expected on April 24, 2024, with BTC’s current price at over $67K as of April 2, 2024.
The historical significance of Bitcoin’s halving events demonstrates a record of retracing pre-halving, followed by accumulation post-halving and higher highs after each halving. Bitcoin’s price action is driven by its deflationary tokenomics, coupled with market sentiment toward Bitcoin and innovations surrounding its ecosystem, such as payment systems, inscription novelty, Bitcoin Spot ETFs, and various DApps. With the backdrop of increasing institutional interest and a dynamic regulatory environment, Bitcoin’s 2024 halving event remains a key event for both opportunities and challenges.
Key Themes For 2024
Bitcoin Ecosystem
The Bitcoin ecosystem is on the brink of expansion, fueled by various factors, such as BTC halving, institutional adoption of BTC Spot ETFs, and advancements in DApps built directly on the Bitcoin network.
The rising popularity of Bitcoin Ordinals, as well as BRC-20 tokens, BRC-420 tokens, and Runes protocol, along with the increasing importance of the Lightning Network and other Layer 2 solutions, is reshaping the digital finance landscape, highlighting the growing diversity of digital assets within the Bitcoin ecosystem.
Ethereum Spot ETF Approvals
Institutions and investors remain sanguine regarding the outlook of ETH ETF approvals despite the SEC delaying their decision multiple times. Highlighting that the concerns surrounding the potential implications of ETH ETF approval are baseless, as Ethereum’s Proof-of-Stake (PoS) implementation meets and even exceeds the security of Bitcoin’s proof-of-work (PoW), deterring centralization risks, higher attack costs, penalties for validator rule violations, and superior environmental sustainability compared to Bitcoin.
With multiple institutions having their spot ETH ETF approvals pending final decision in May 2024, the potential approval of Ethereum Spot ETFs could mirror the trajectory observed with BTC, potentially leading to substantial growth.
Solana Ecosystem
The Solana ecosystem has witnessed remarkable growth and performance over the past two quarters, with its native token soaring from $20 to a peak of $200. This surge in value has drawn significant attention, particularly from retail investors seeking alternatives to Ethereum’s high gas fees.
Furthermore, Solana has emerged as a hotspot for airdrop farming narratives, with several prominent projects like Kamino and Wormhole announcing their airdrops, contributing to Solana’s expanding user base.
In addition, Solana has incubated many memecoin projects in recent months, including notable entries like BONK and WIF, which further underscores its potential as a preferred option for memecoin launches. As the ecosystem continues to evolve, it’s conceivable that we may witness the emergence of more noteworthy memecoins on the Solana network.
For investors looking to capitalize on the burgeoning memecoin market within the Solana ecosystem, Bybit offers a range of trading pairs for many popular memecoins. Additionally, Bybit stands out as one of the few exchanges offering Solana options, enabling traders to execute non-delta-one strategies on the Solana network.
DePIN
Decentralized physical infrastructure network (DePIN) projects are gaining momentum within the ownership economy landscape. This trend stems from several factors, including the advancement of infrastructure development in the blockchain sphere, an increasing recognition of user sovereignty over traditionally centralized resources, and the expanding cryptocurrency user base. DePIN initiatives typically utilize token-based incentives to foster the creation and utilization of resources for real-world applications, such as GPU computing power and WiFi bandwidth. Some notable projects that have already been gaining traction in this sector include Akash Network (AKT) for computing power, Helium (HNT) for wireless services to IoT devices, and Render (RNDR) for graphic rendering services.
Artificial Intelligence
AI is poised for continued growth as real-world applications across various sectors, spearheaded by entities like OpenAI, demonstrate the tangible benefits of AI solutions. Additionally, the convergence of AI and crypto is an area of keen anticipation, as these technologies are expected to facilitate enhanced analysis and improved user experience (UX) within the complex crypto landscape.
We can anticipate the expansion of AI projects that leverage blockchain networks for sectors such as trading bots, predictive analysis and more, translating theoretical concepts into practical, real-world usage. Notable endeavors such as Bittensor (TAO) are pioneering the development of censorship-resistant, decentralized machine-learning models, while Grass is laying the groundwork for a decentralized oracle to facilitate AI training data sourcing from global internet connectivity.
Account Abstractions
Account abstraction is becoming increasingly crucial in facilitating the onboarding of the next billion crypto users and expediting blockchain adoption. This innovative approach holds the potential to significantly enhance the UX within the crypto world, laying the groundwork for new advancements such as social recovery and multi-currency gas payments. As the space continues to garner hype, we anticipate the rapid rollout of new innovations aimed at catering to the diverse needs of crypto consumers.
The competition among companies vying to offer the most user-friendly crypto wallets is expected to drive rapid advancements in this space, making wallet usage more intuitive and seamless than ever before. This development is particularly significant for institutional entities seeking to streamline their operations, as it enables them to avoid holding gas tokens on their balance sheets, thereby mitigating potential price fluctuations.
One notable example of this development is JP Morgan’s proof-of-concept report under Project Guardia, which showcases the handling of all gas payments through Biconomy’s Paymaster service, emphasizing the practical implications of account abstraction in real-world scenarios.
Tokenization of Real-World Assets
Tokenization of real-world assets (RWAs) represents a transformative trend in finance, offering enhanced liquidity, transparency, and accessibility to traditional assets through blockchain technology.
As we look ahead to 2024, this trend is expected to accelerate, with tokenization possibly extending to a broader array of assets, including equities, private market funds, insurance products, and carbon credits. This expansion is being driven both by growing demand for higher-yielding products and the need for diversified sources of return in today’s market environment.
RWAs, particularly tokenized treasuries, are anticipated to remain attractive as investors seek alternative avenues for yield generation amid changing market dynamics. However, regulatory developments in key jurisdictions, such as Singapore, the EU, and the U.K., will play a pivotal role in shaping the trajectory of tokenization and influencing investor sentiment. Projects like Ondo Finance are at the forefront of this movement, spearheading initiatives to tokenize RWAs and foster innovation within the DeFi realm.
Institutional Investors Need Institution-Ready Exchanges
For institutional investors, navigating the landscape of digital asset trading requires careful evaluation when selecting an exchange that will align with their investment objectives and operational requirements.
Some critical considerations for institutional investors include the following:
- Legality and Compliance: Prioritize exchanges that are compliant with relevant regulations to minimize legal risks in respective jurisdictions.
- Liquidity: Choose exchanges with deep liquidity in their order books to facilitate efficient order execution.
- Diversity of Pairs and Instruments: Seek exchanges offering a wide range of trading pairs and instruments to allow for greater strategic flexibility.
- Competitive Fees: Select platforms that feature competitive fee structures without compromising service quality.
- Institutional Offerings: Opt for exchanges with institution-tailored services, such as prime loans and custody solutions to meet institutional needs.
Bybit: A Premier Destination for Institutional Investors
Following these considerations, institutional investors seeking a reliable and comprehensive trading platform may find Bybit to be an ideal choice as their primary exchange. Bybit stands out for its unwavering commitment to legality, ensuring a secure and compliant trading environment. With exceptional liquidity and a diverse range of trading pairs and instruments, Bybit caters to the sophisticated demands of institutional clients. Additionally, competitive trading fees enhance Bybit’s appeal as a partner for institutional trading activities.
Furthermore, Bybit’s suite of institution-specific offerings, including institutional loans, reflects its dedication to meeting the unique needs of professional investors. These tailored services provide institutions with the tools and support necessary to navigate digital asset markets confidently.
Closing Thoughts
The crypto market appears to be emerging from its long winter, buoyed by increasing clarity in regulatory landscapes and a notable uptick in institutional adoption. Combined with the approval of Bitcoin ETFs and growing confidence among investors, this suggests a promising outlook for the future of digital assets.
Here at Bybit and Treehouse, we maintain a bullish stance on the crypto markets and the ongoing innovations within the industry. We remain dedicated to supporting the growth and development of blockchain technology and recognizing the transformative potential it holds for various sectors worldwide.
As we move forward, we’re excited about the opportunities that lie ahead and are committed to staying at the forefront of industry advancements. We welcome collaboration and partnership opportunities with projects and individuals who share our vision for a decentralized future.
As we navigate the evolving landscape of digital assets, Bybit stands as a reliable partner for your trading needs. With exceptional liquidity, competitive trading fees, and a commitment to legality, Bybit offers institutional investors a secure and comprehensive platform to execute their strategies effectively. Explore the possibilities with Bybit today!
Meanwhile, keep an eye on our continued deep dives into the crypto world via the Treehouse Daily newsletter and Treehouse Insights research. With our daily updates and in-depth analysis, Treehouse remains a key resource for understanding the complexities and opportunities within the ever-changing crypto market. Join us as we explore the future of finance together!